

Question: USE PYTHON (JUPYTER) Question 2 - Arrays, Grids and Plotting (10 marks) Question 2 (6 marks) Starting with the code and data below, modify and
USE PYTHON (JUPYTER)
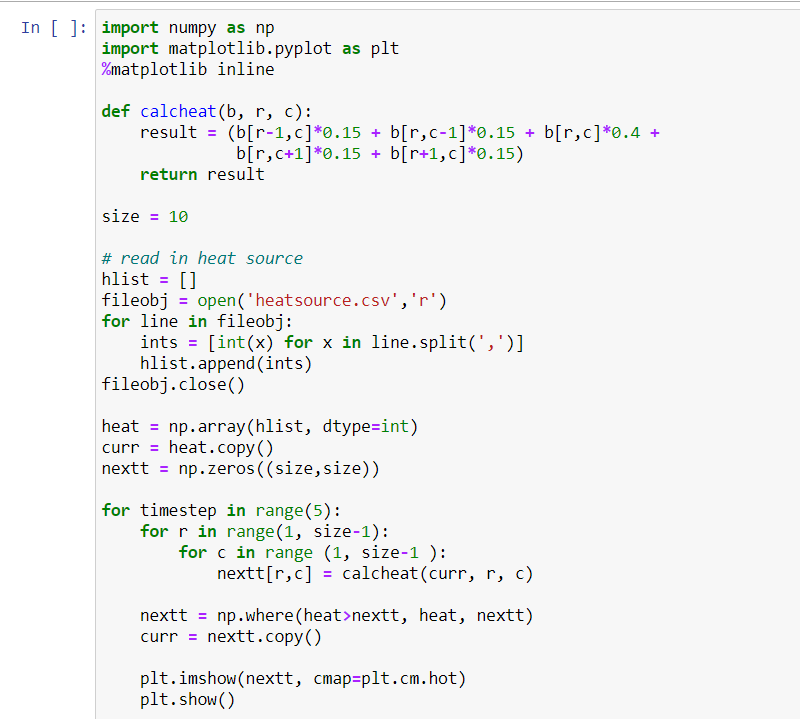
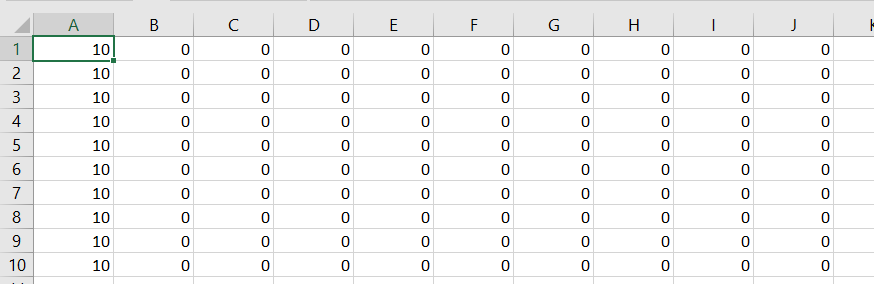
Question 2 - Arrays, Grids and Plotting (10 marks) Question 2 (6 marks) Starting with the code and data below, modify and extend it to: 1. Replace the colour map with a map of your choice (1 mark) 2. Display the plot once - at the end of the simulation (1 mark) 3. Add inline comments explain each line after "#read in heat source" (3 marks) 4. Modify heatsource.csv to have four 10's in each corner of the grid (1 mark) In [ ]: import numpy as np import matplotlib.pyplot as plt %matplotlib inline def calcheat(b, r, c): result = (b[r-1,c]*0.15 + b[r,c-1]*0.15 + b[r,c]*0.4 + b[r,C+1]*0.15 + b[r+1,c]*0.15) return result size = 10 # read in heat source hlist = [] fileobj = open('heatsource.csv', 'r') for line in fileobj: ints = [int(x) for x in line.split(',')] hlist.append(ints) fileobj.close() heat = np.array(hlist, dtype=int) curr = heat.copy) nextt = np.zeros((size,size)) for time step in range(5): for r in range(1, size-1): for c in range (1, size-1 ): nextt[r,c] = calcheat(curr, r, c) nextt = np.where (heat>nextt, heat, nextt) curr = nextt.copy() plt.imshow(nextt, cmap=plt.cm.hot) plt.show() A B D E F G H 1 0 o 0 0 0 0 0 0 0 0 0 0 10 10 10 10 10 0 0 0 0 0 0 0 0 0 0 0 0 0 0 0 0 0 0 0 0 0 0 0 0 0 0 0 0 0 0 0 0 0 0 0 2 3 4 5 6 7 8 9 10 0 0 0 10 0 0 0 0 0 0 10 0 0 0 0 0 0 0 10 0 0 0 0 0 0 0 0 0 0 0 0 0 0 0 0 0 0 10 10 0 0 0 0 0 0 0 0 0 Question 2 - Arrays, Grids and Plotting (10 marks) Question 2 (6 marks) Starting with the code and data below, modify and extend it to: 1. Replace the colour map with a map of your choice (1 mark) 2. Display the plot once - at the end of the simulation (1 mark) 3. Add inline comments explain each line after "#read in heat source" (3 marks) 4. Modify heatsource.csv to have four 10's in each corner of the grid (1 mark) In [ ]: import numpy as np import matplotlib.pyplot as plt %matplotlib inline def calcheat(b, r, c): result = (b[r-1,c]*0.15 + b[r,c-1]*0.15 + b[r,c]*0.4 + b[r,C+1]*0.15 + b[r+1,c]*0.15) return result size = 10 # read in heat source hlist = [] fileobj = open('heatsource.csv', 'r') for line in fileobj: ints = [int(x) for x in line.split(',')] hlist.append(ints) fileobj.close() heat = np.array(hlist, dtype=int) curr = heat.copy) nextt = np.zeros((size,size)) for time step in range(5): for r in range(1, size-1): for c in range (1, size-1 ): nextt[r,c] = calcheat(curr, r, c) nextt = np.where (heat>nextt, heat, nextt) curr = nextt.copy() plt.imshow(nextt, cmap=plt.cm.hot) plt.show() A B D E F G H 1 0 o 0 0 0 0 0 0 0 0 0 0 10 10 10 10 10 0 0 0 0 0 0 0 0 0 0 0 0 0 0 0 0 0 0 0 0 0 0 0 0 0 0 0 0 0 0 0 0 0 0 0 2 3 4 5 6 7 8 9 10 0 0 0 10 0 0 0 0 0 0 10 0 0 0 0 0 0 0 10 0 0 0 0 0 0 0 0 0 0 0 0 0 0 0 0 0 0 10 10 0 0 0 0 0 0 0 0 0
Step by Step Solution
There are 3 Steps involved in it

Get step-by-step solutions from verified subject matter experts