

Question: Use Python Pandas Library The image file contains information about employees of a company with following information: First Name', 'Gender', 'Start Date', 'Last Login Time',
Use Python Pandas Library
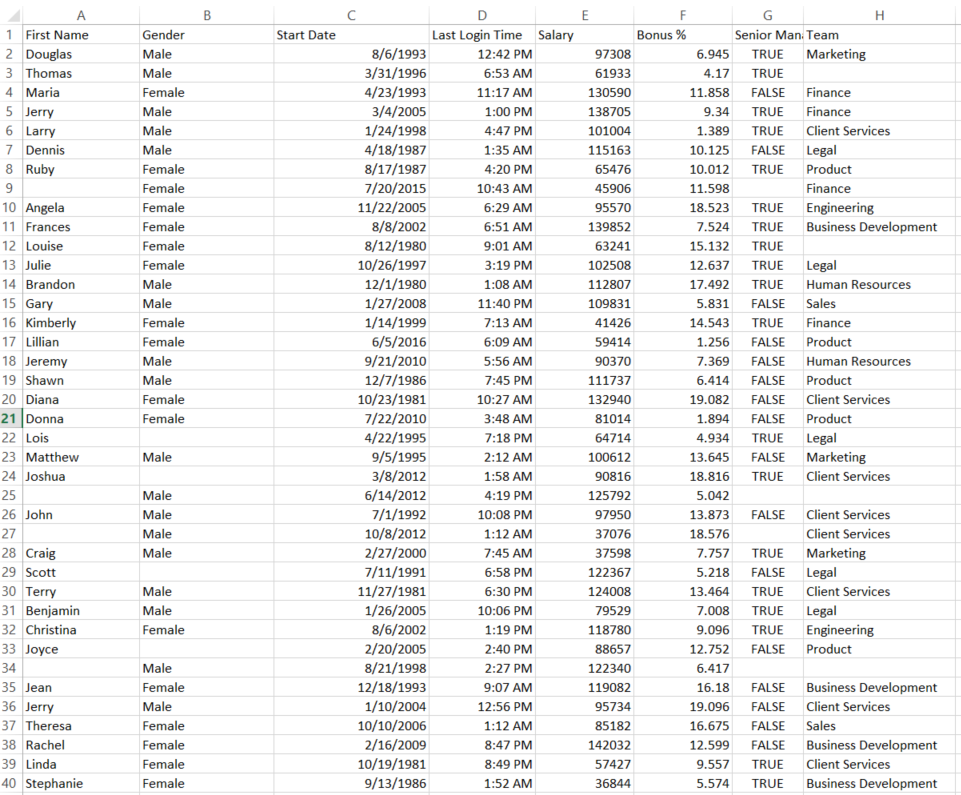
The image file contains information about employees of a company with following information: First Name', 'Gender', 'Start Date', 'Last Login Time', 'Salary', 'Bonus %', 'Senior Management', 'Team' 1. Read the csv file and provide summary of the DataFrame by printing the object. 2. Fill all the null values in Gender column with No Gender and 'Senior Management' column with Dont Know. 3. Using the fillna (0), fillna () with method ffill and interpolate () function to fill the missing values in 'Salary', 'Bonus %' columns and calculate the average (mean) salary and bonus for each method. 4. Filter the rows to only show employee with Salaries >100K. 5. Print the names of male and female employees with highest and lowest salaries. 6. For each Team, calculate the minimum and maximum salaries. 7. Find the maximum and average salary of Male and Female as different groups. 8. For each combination of Team and Gender, calculate the mean salary. 9. Check the number of rows and columns and drop those row if 'any' values are missing in a row. 10. Find all the employees whose bonuses are in the range of >=5% and
Step by Step Solution
There are 3 Steps involved in it

Get step-by-step solutions from verified subject matter experts