

Question: use python pls Previously, an X was used to represent every integer value. However, we don't have space to represent large values using the approach
use python pls
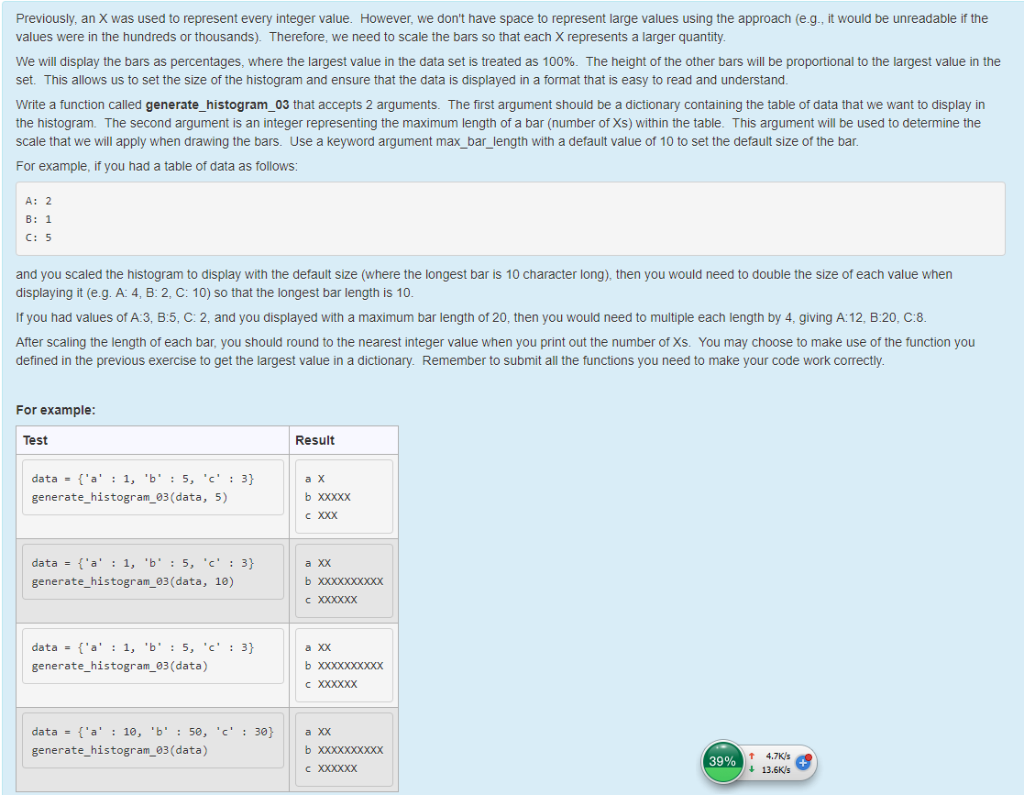
Previously, an X was used to represent every integer value. However, we don't have space to represent large values using the approach (e.g., it would be unreadable if the values were in the hundreds or thousands). Therefore, we need to scale the bars so that each X represents a larger quantity We will display the bars as percentages, where the largest value in the data set is treated as 100%. The height of the other bars will be proportional to the largest value in the set. This allows us to set the size of the histogram and ensure that the data is displayed in a format that is easy to read and understand Write a function called generate_histogram_03 that accepts 2 arguments. The first argument should be a dictionary containing the table of data that we want to display in the histogram. The second argument is an integer representing the maximum length of a bar (number of Xs) within the table. This argument will be used to determine the scale that we will apply when drawing the bars. Use a keyword argument max bar_length with a default value of 10 to set the default size of the bar. For example, if you had a table of data as follows A: 2 and you scaled the histogram to display with the default size (where the longest bar is 10 character long), then you would need to double the size of each value whern displaying it (e.g. A: 4, B: 2, C: 10) so that the longest bar length is 10 If you had values of A:3, B:5, C: 2, and you displayed with a maximum bar length of 20, then you would need to multiple each length by 4, giving A:12, B:20, C:8 After scaling the length of each bar, you should round to the nearest integer value when you print out the number of Xs. You may choose to make use of the function you defined in the previous exercise to get the largest value in a dictionary. Remember to submit all the functions you need to make your code work correctly For example Test Result a x b XXxxX generate histogram 03 (data, 5) data -f'a 1, b5, c3) generate his togram 03(data, 1e) a XX c XxXX data-('a : 1, b: 5, c3) generate histogram_03 (data) a xx generate histogram 03 (data) t 4.7K/s 13.6K s 39% c xXxxXX
Step by Step Solution
There are 3 Steps involved in it

Get step-by-step solutions from verified subject matter experts