

Question: Use python to create 3 different plots of the following functions: Create 3 plots and limit the horizontal x-axis to n = 5,
Use python to create 3 different plots of the following functions:
• Create 3 plots and limit the horizontal x-axis to n = 5, 15, 50. On each of the 3 plots, show the above 3 functions. On the first plot the x-axis is limited to 5, on second one x-axis is limited to 15, and on the 3rd one x-axis is limited to 50.
• Visualize the 3 functions in 3 colors ( f1 in red, f2 in blue, f3 in green).
• Describe your visualization and explain what is shown in each plot.
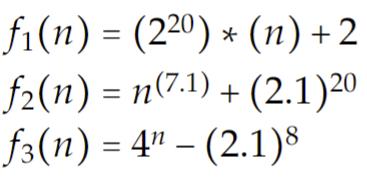
= (220) + (n) + 2 * f(n) 2(n) = n(7.1) + (2.1) 20 f(n) = 4 - (2.1)8
Step by Step Solution
3.47 Rating (163 Votes )
There are 3 Steps involved in it
To achieve this you can use the matplotlib library in Python Heres an example code snippet f... View full answer

Get step-by-step solutions from verified subject matter experts