

Question: use python to do Project 2: Supreme Court DB,SUBMIT HERE Attached Files: SupremeCourtProjectOnlyFA2018.pdf (40.986 KB) 1. Create the subset of all cases from the 2000
use python to do 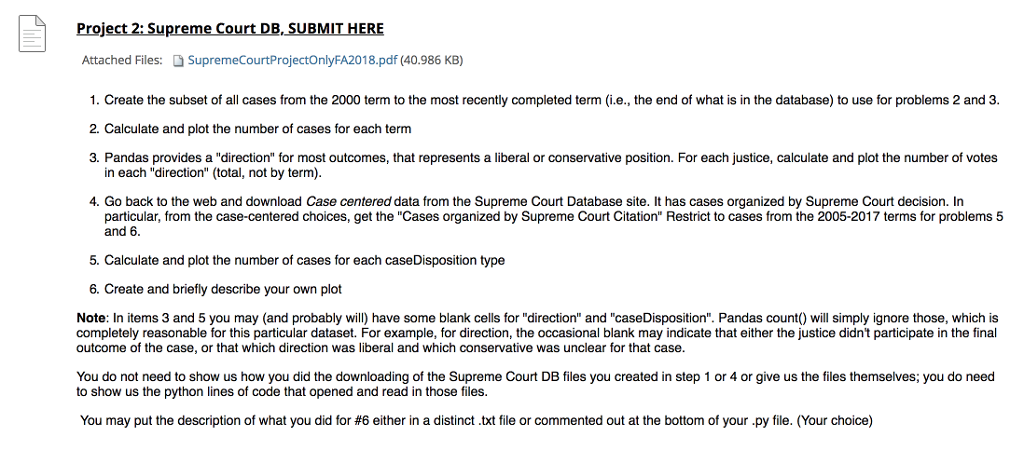
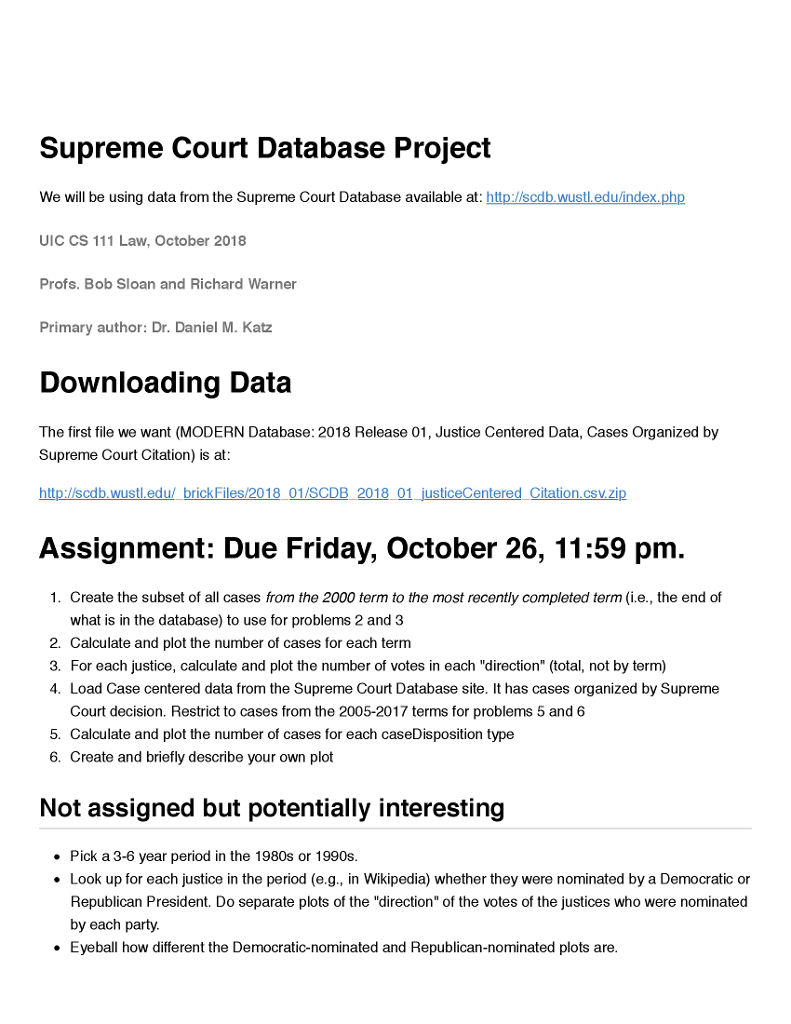

Project 2: Supreme Court DB,SUBMIT HERE Attached Files: SupremeCourtProjectOnlyFA2018.pdf (40.986 KB) 1. Create the subset of all cases from the 2000 term to the most recently completed term (i.e., the end of what is in the database) to use for problems 2 and 3 2. Calculate and plot the number of cases for each term 3. Pandas provides a "direction" for most outcomes, that represents a liberal or conservative position. For each justice, calculate and plot the number of votes in each "direction" (total, not by term 4. Go back to the web and download Case centered data from the Supreme Court Database site. It has cases organized by Supreme Court decision. In particular, from the case-centered choices, get the "Cases organized by Supreme Court Citation" Restrict to cases from the 2005-2017 terms for problems 5 and 6. 5. Calculate and plot the number of cases for each caseDisposition type 6. Create and briefly describe your own plot Note: In items 3 and 5 you may (and probably will) have some blank cells for "direction" and "caseDisposition". Pandas count) will simply ignore those, which is completely reasonable for this particular dataset. For example, for direction, the occasional blank may indicate that either the justice didn't participate in the final outcome of the case, or that which direction was liberal and which conservative was unclear for that case. You do not need to show us how you did the downloading of the Supreme Court DB files you created in step 1 or 4 or give us the files themselves; you do need to show us the python lines of code that opened and read in those files You may put the description of what you did for #6 either in a distinct txt file or commented out at the bottom of your y ile. Your choice Project 2: Supreme Court DB,SUBMIT HERE Attached Files: SupremeCourtProjectOnlyFA2018.pdf (40.986 KB) 1. Create the subset of all cases from the 2000 term to the most recently completed term (i.e., the end of what is in the database) to use for problems 2 and 3 2. Calculate and plot the number of cases for each term 3. Pandas provides a "direction" for most outcomes, that represents a liberal or conservative position. For each justice, calculate and plot the number of votes in each "direction" (total, not by term 4. Go back to the web and download Case centered data from the Supreme Court Database site. It has cases organized by Supreme Court decision. In particular, from the case-centered choices, get the "Cases organized by Supreme Court Citation" Restrict to cases from the 2005-2017 terms for problems 5 and 6. 5. Calculate and plot the number of cases for each caseDisposition type 6. Create and briefly describe your own plot Note: In items 3 and 5 you may (and probably will) have some blank cells for "direction" and "caseDisposition". Pandas count) will simply ignore those, which is completely reasonable for this particular dataset. For example, for direction, the occasional blank may indicate that either the justice didn't participate in the final outcome of the case, or that which direction was liberal and which conservative was unclear for that case. You do not need to show us how you did the downloading of the Supreme Court DB files you created in step 1 or 4 or give us the files themselves; you do need to show us the python lines of code that opened and read in those files You may put the description of what you did for #6 either in a distinct txt file or commented out at the bottom of your y ile. Your choice
Step by Step Solution
There are 3 Steps involved in it

Get step-by-step solutions from verified subject matter experts