

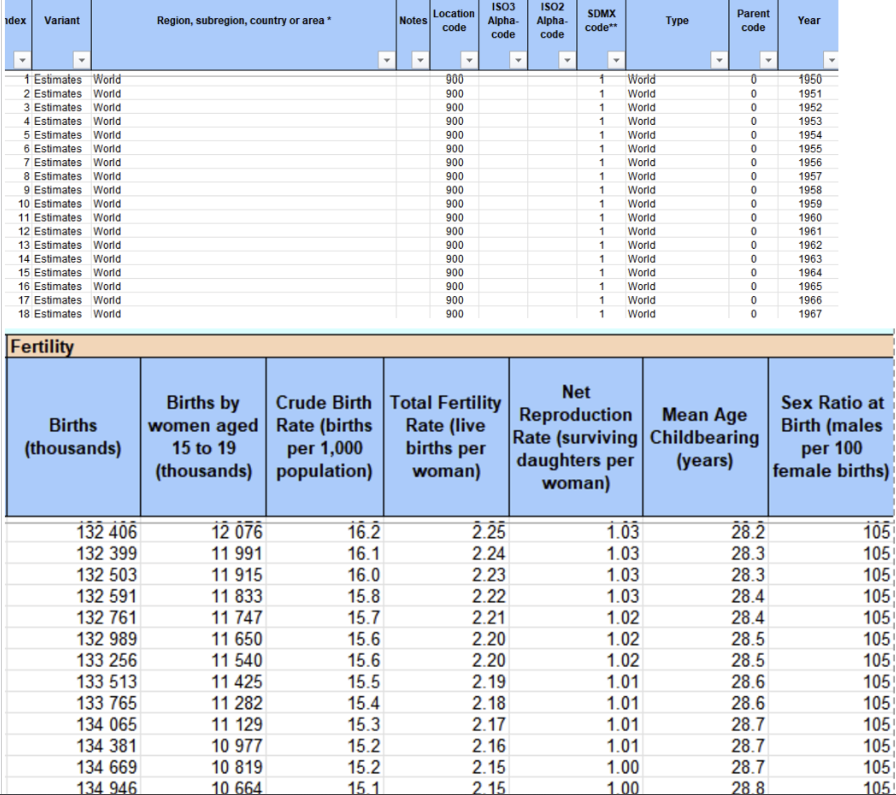
Question: Use R code: Select United States related data, and any other country or region ( s ) of your choosing to perform EDA. Chart 3
Use R code: Select United States related data, and any other country or regions of your choosing to perform EDA. Chart line graphs that may show relationships like correlations, frequencies, trend charts, between various variables. Every plot should have a title and the xy axis should have legible labels without any label overlaps for full credit.
Summarize your interpretations after each chart.
Step by Step Solution
There are 3 Steps involved in it
1 Expert Approved Answer
Step: 1 Unlock

Question Has Been Solved by an Expert!
Get step-by-step solutions from verified subject matter experts
Step: 2 Unlock
Step: 3 Unlock