

Question: USE 'R' CODES TO EXPLAIN EACH SECTION WITH INTERPRETATIONS Use the data AirfarePanel.xlsx where the id (i) denotes a specific route and for each route,
USE 'R' CODES TO EXPLAIN EACH SECTION WITH INTERPRETATIONS
Use the data AirfarePanel.xlsx where the id (i) denotes a specific route and for each route, we have, for the years (t) 1997, 1998, 1999 and 2000, the routes distance, the average passengers per day in that route, the average one-way fare charged and the market share of the biggest career in that route. We want to use this data to estimate the following model: log log log Here, allows a different intercept for each year. a) Estimate the pooled OLS model for the above equation (be sure to add the year dummies, but not the individual route effects.) For a change of 0.1, what is the estimated percentage change in the fare? Use the robust standard errors to calculate the 95% confidence interval of this effect. b) What does the estimate quadratic in log(distance) tell you about the effects of the distance of the route on the fares charged? c) Now estimate the random effects model. How does the estimate of 1 change? d) Now estimate the fixed effects model (i.e. now we use the plm function with model = within to include the ) How does this compare with the pooled model and the RE models? Are you satisfied that the concentration on a route has a significant effect on the fares of that route? e) What characteristics, other than the fixed distance of the route, does these fixed effects () capture?
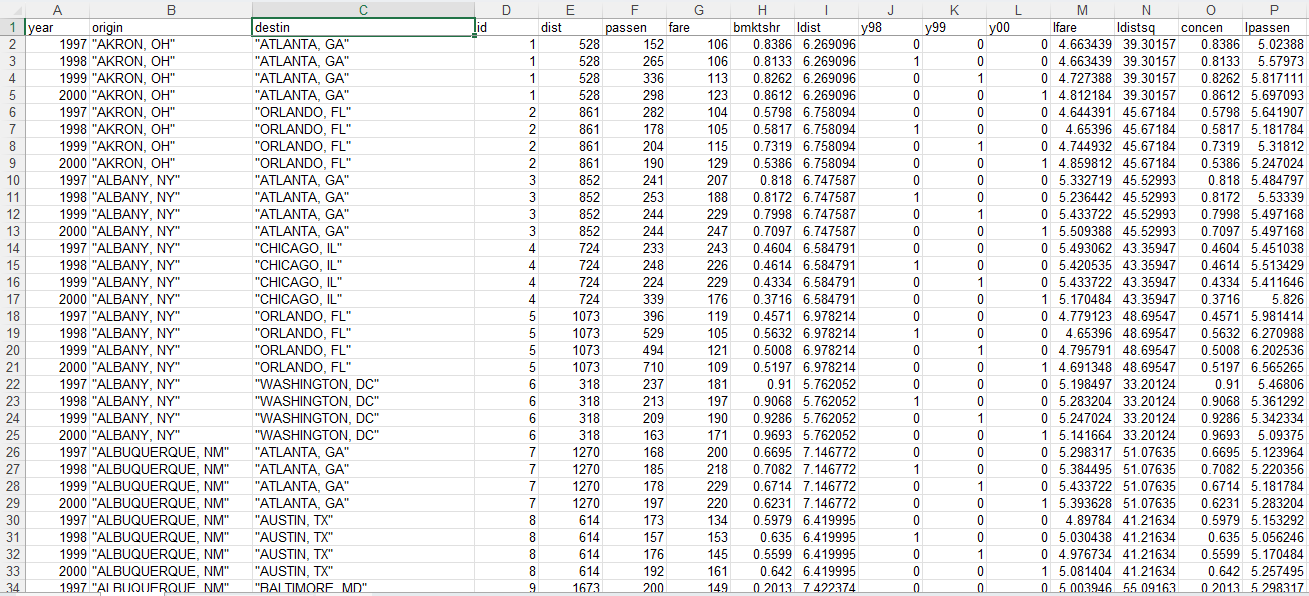
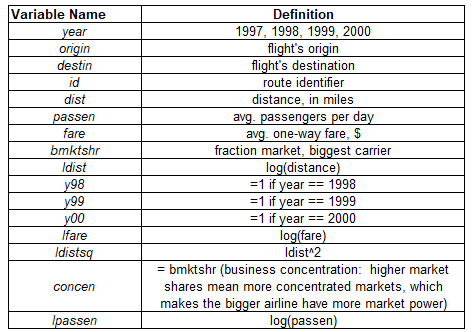
\begin{tabular}{|c|c|} \hline Variable Name & Definition \\ \hline year & 1997, 1998, 1999, 2000 \\ \hline origin & flight's origin \\ \hline destin & flight's destination \\ \hline id & route identifier \\ \hline dist & distance, in miles \\ \hline passen & avg. passengers per day \\ \hline fare & avg. one-way fare, $ \\ \hline bmktshr & fraction market, biggest carrier \\ \hline Idist & log(distance) \\ \hline y98 & =1 if year ==1998 \\ \hline y99 & =1 if year ==1999 \\ \hline y00 & =1 if year ==2000 \\ \hline Ifare & log(fare) \\ \hline Idistsq & Idist 2 \\ \hline concen & =bmktshr(businessconcentration:highermarketsharesmeanmoreconcentratedmarkets,whichmakesthebiggerairlinehavemoremarketpower) \\ \hline Ipassen & log(passen) \\ \hline \end{tabular}
Step by Step Solution
There are 3 Steps involved in it

Get step-by-step solutions from verified subject matter experts