

Question: Use R . I cannot send the data set but it is just named BookGenres is just w two column entry with Title and Authors.
Use R I cannot send the data set but it is just named "BookGenres" is just w two column entry with "Title" and "Authors". Thus, I don't need the graphed plots, I can test that out with the given code. Thanks
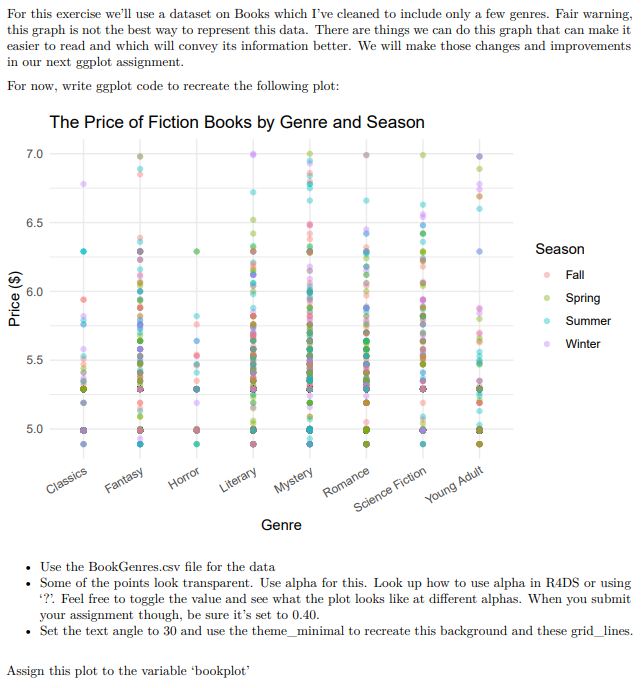
For this exercise we'll use a dataset on Books which I've cleaned to include only a few genres. Fair warning, this graph is not the best way to represent this data. There are things we can do this graph that can make it easier to read and which will convey its information better. We will make those changes and improvements in our next ggplot assignment.
For now, write ggplot code to recreate the following plot:
Tha Drina of Lintion Ronko hus Conra and Canonn
ason
Fall
Spring
Summer
Winter
Genre
Use the BookGenres.csv file for the data
Some of the points look transparent. Use alpha for this. Look up how to use alpha in RDS or using Feel free to toggle the value and see what the plot looks like at different alphas. When you submit your assignment though, be sure it's set to
Set the text angle to and use the thememinimal to recreate this background and these gridlines.
Assign this plot to the variable 'bookplot'
Step by Step Solution
There are 3 Steps involved in it
1 Expert Approved Answer
Step: 1 Unlock

Question Has Been Solved by an Expert!
Get step-by-step solutions from verified subject matter experts
Step: 2 Unlock
Step: 3 Unlock