

Question: Use R or Python Please!! Consider the following Limit Order Book for the resting Bid limit orders: Price Level Quantity 35.02 50 35.00 35 34.99
 Use R or Python Please!!
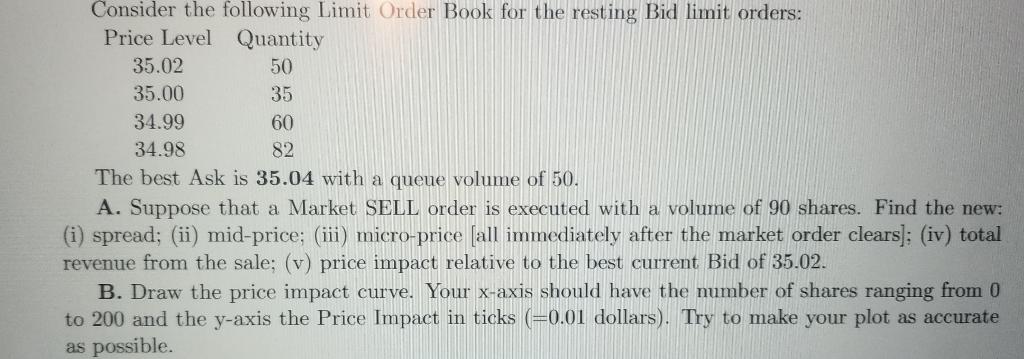
Consider the following Limit Order Book for the resting Bid limit orders: Price Level Quantity 35.02 50 35.00 35 34.99 60 34.98 82 The best Ask is 35.04 with a queue volume of 50. A. Suppose that a Market SELL order is executed with a volume of 90 shares. Find the new: (i) spread; (ii) mid-price; (iii) micro-price [all immediately after the market order clears): (iv) total revenue from the sale; (v) price impact relative to the best current Bid of 35.02. B. Draw the price impact curve. Your X-axis should have the number of shares ranging from 0 to 200 and the y-axis the Price Impact in ticks (=0.01 dollars). Try to make your plot as accurate as possible. Consider the following Limit Order Book for the resting Bid limit orders: Price Level Quantity 35.02 50 35.00 35 34.99 60 34.98 82 The best Ask is 35.04 with a queue volume of 50. A. Suppose that a Market SELL order is executed with a volume of 90 shares. Find the new: (i) spread; (ii) mid-price; (iii) micro-price [all immediately after the market order clears): (iv) total revenue from the sale; (v) price impact relative to the best current Bid of 35.02. B. Draw the price impact curve. Your X-axis should have the number of shares ranging from 0 to 200 and the y-axis the Price Impact in ticks (=0.01 dollars). Try to make your plot as accurate as possible
Step by Step Solution
There are 3 Steps involved in it

Get step-by-step solutions from verified subject matter experts