

Question: Use R Studio: Simple Linear Regression: The heights and weights of six self-identified women are given below eight (inches 61 62 63 64 eight (pounds
Use R Studio:
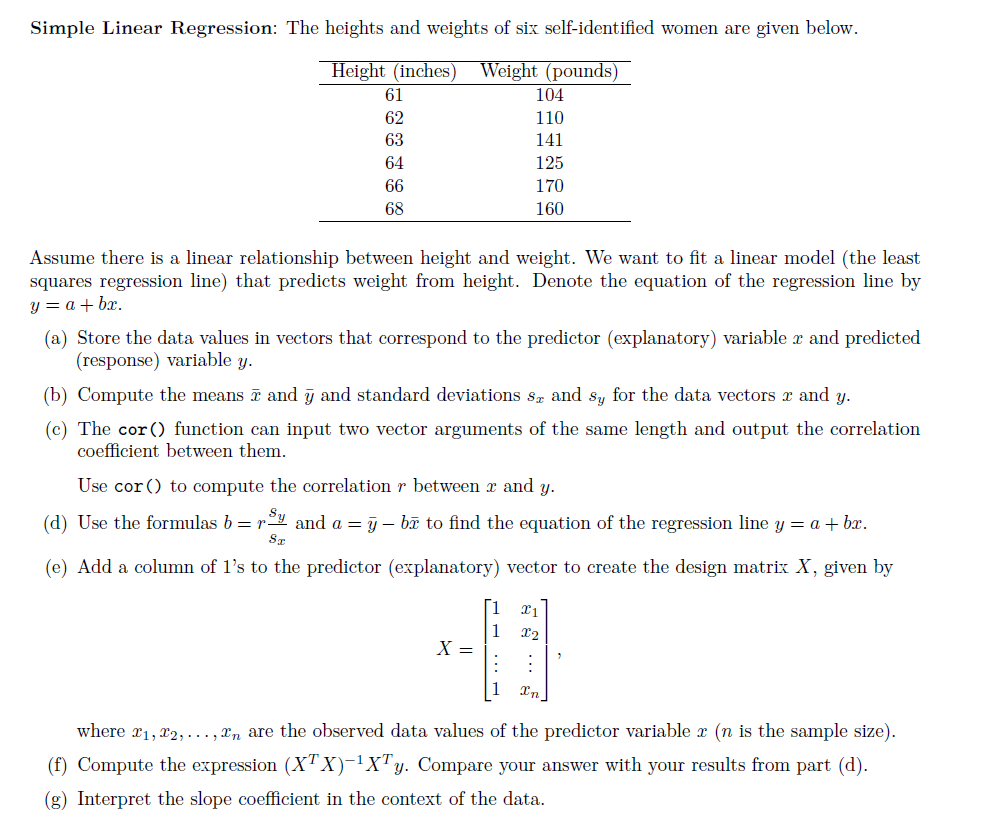
Simple Linear Regression: The heights and weights of six self-identified women are given below eight (inches 61 62 63 64 eight (pounds 104 110 141 125 170 160 68 Assume there is a linear relationship between height and weight. We want to fit a linear model (the least squares regression line) that predicts weight from height. Denote the equation of the regression line by y=a+02. (a) Store the data values in vectors that correspond to the predictor (explanatory) variable r and predicted (response) variable 3y (b) Compute the means and y and standard deviations sz and sy for the data vectors r and y (c) The cor () function can input two vector arguments of the same length and output the correlation coefficient between them Use cor) to compute the correlation r between x and y (d) Use the formulas band a j - bz to find the equation of the regression line y a +br. (e) Add a column of 1's to the predictor (explanatory) vector to create the design matrix X, given by 72 where xi, 22,... ,?n are the observed data values of the predictor variable x (n is the sample size) (f) Compute the expression (XTX)-. Compare your answer with your results from part (d) (g) Interpret the slope coefficient in the context of the data. Simple Linear Regression: The heights and weights of six self-identified women are given below eight (inches 61 62 63 64 eight (pounds 104 110 141 125 170 160 68 Assume there is a linear relationship between height and weight. We want to fit a linear model (the least squares regression line) that predicts weight from height. Denote the equation of the regression line by y=a+02. (a) Store the data values in vectors that correspond to the predictor (explanatory) variable r and predicted (response) variable 3y (b) Compute the means and y and standard deviations sz and sy for the data vectors r and y (c) The cor () function can input two vector arguments of the same length and output the correlation coefficient between them Use cor) to compute the correlation r between x and y (d) Use the formulas band a j - bz to find the equation of the regression line y a +br. (e) Add a column of 1's to the predictor (explanatory) vector to create the design matrix X, given by 72 where xi, 22,... ,?n are the observed data values of the predictor variable x (n is the sample size) (f) Compute the expression (XTX)-. Compare your answer with your results from part (d) (g) Interpret the slope coefficient in the context of the data
Step by Step Solution
There are 3 Steps involved in it

Get step-by-step solutions from verified subject matter experts