

Question: Use R studio; This problem uses the mpe data set in the saplot2 package. (a) Which variables in mps are categorical? Which variables are continuous?
Use R studio;
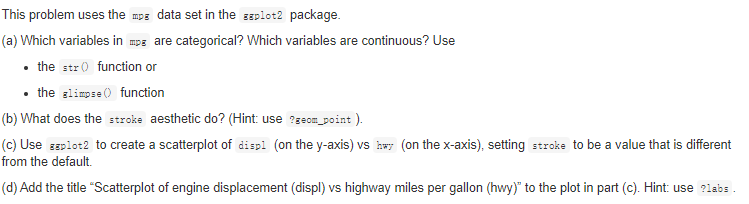
This problem uses the mpe data set in the saplot2 package. (a) Which variables in mps are categorical? Which variables are continuous? Use the stro function or the glimpse O function (b) What does the stroke aesthetic do? (Hint: use ?geom_point). (C) Use saplot2 to create a scatterplot of displ (on the y-axis) vs hw (on the x-axis), setting stroke to be a value that is different from the default (d) Add the title "Scatterplot of engine displacement (displ) vs highway miles per gallon (hwy)" to the plot in part (c). Hint: use ?labs
Step by Step Solution
There are 3 Steps involved in it
1 Expert Approved Answer
Step: 1 Unlock

Question Has Been Solved by an Expert!
Get step-by-step solutions from verified subject matter experts
Step: 2 Unlock
Step: 3 Unlock