

Question: Use R Studio To start, a. Make sure you install and library below two packages: - forecast - ggplot 2 b. Import plantpot. x ls
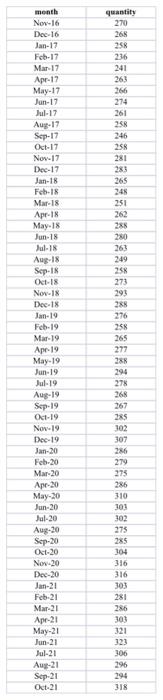
To start, a. Make sure you install and library below two packages: - forecast - ggplot 2 b. Import plantpot. x ls x to RStudio c. Convert the imported dataset to data frame d. Create time series object of the quantity column from the dataset. Note: Recall the excel file carries data between November 2017 and Q ctober 2022 , so the "start" and "end" arguments inside the ts() function need to be customized to past data. See code hint below: quantityTS =c(2017,11), end =c(2022,10). frequency =12) Then, please proceed to explore answers for below questions. (1) Visualize the time series object using the autoplot f function. What pattern(s) can you tell from the plot? ( 1 point) Note: put your response in the comment starting with "\#" (2) Visualize the autocorrelation of the time series object using the ggAcfO function. Do you see any autocorrelation carried in the data? ( 1 point) Note: put your response in the comment starting with "\#" (3) Partition the time series into training and validation periods, with the validation set containing the last 12 months of data. (1 point) Note: you create the "validation" and "train" objects first. Then, see below code hint for creating the train_data and validation_data objects, assuming the created time series object name is quantityTS in your script. train_data
Step by Step Solution
There are 3 Steps involved in it

Get step-by-step solutions from verified subject matter experts