

Question: Use R The Iris flower data set https //en.wikipedia.org/wiki/lris_flower_data_set is a multivariate data set introduced by the famous statistician Ronald Fisher. The data set consists
Use R
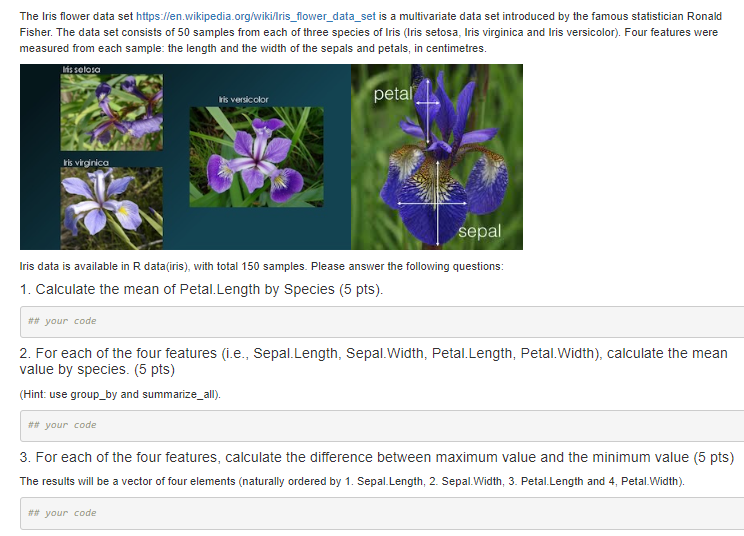
The Iris flower data set https //en.wikipedia.org/wiki/lris_flower_data_set is a multivariate data set introduced by the famous statistician Ronald Fisher. The data set consists of 50 samples from each of three species of Iris (Iris setosa, Iris virginica and Iris versicolor). Four features were measured from each sample: the length and the width of the sepals and petals, in centimetres. his solosa i vonicolor petal kris virginica sepal Iris data is available in R data(iris), with total 150 samples. Please answer the following questions: 1. Calculate the mean of Petal. Length by Species (5 pts). ## your code 2. For each of the four features (i.e., Sepal.Length, Sepal.Width, Petal.Length, Petal.Width), calculate the mean value by species. (5 pts) (Hint: use group_by and summarize_all). ## your code 3. For each of the four features, calculate the difference between maximum value and the minimum value (5 pts) The results will be a vector of four elements (naturally ordered by 1. Sepal Length, 2. Sepal.Width, 3. Petal.Length and 4, Petal.Width). ## your code
Step by Step Solution
There are 3 Steps involved in it

Get step-by-step solutions from verified subject matter experts