

Question: Use R to solve, please provide specific code for this problem. 9.18 (Data file: cloud) The data summarize the results of the first Florida Area
Use R to solve, please provide specific code for this problem.
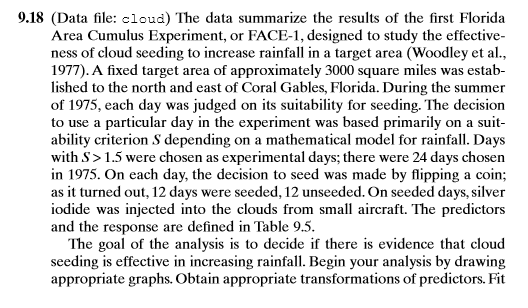
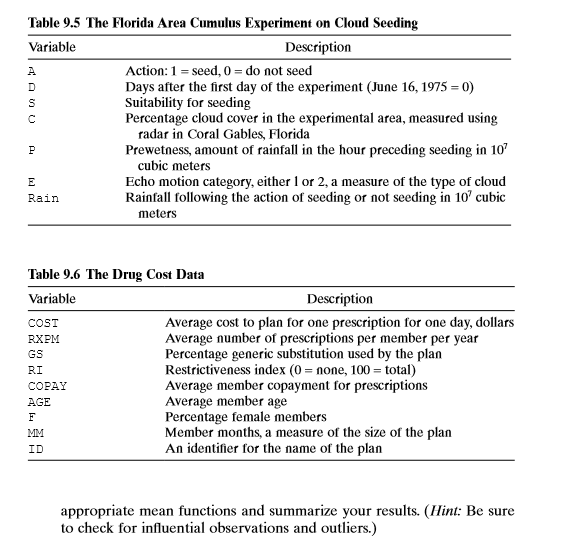
9.18 (Data file: cloud) The data summarize the results of the first Florida Area Cumulus Experiment, or FACE-1, designed to study the effective- ness of cloud seeding to increase rainfall in a target area (Woodley et al., 1977). A fixed target area of approximately 3000 square miles was estab lished to the north and east of Coral Gables, Florida. During the summer of 1975, each day was judged on its suitability for seeding. The decision to use a particular day in the experiment was based primarily on a suit- ability criterion S depending on a mathematical model for rainfall. Days with S > 1.5 were chosen as experimental days; there were 24 days chosen in 1975. On each day, the decision to seed was made by flipping a coin; as it turned out, 12 days were seeded, 12 unseeded. On seeded days, silver iodide was injected into the clouds from small aircraft. The predictors and the response are defined in Table 9.5. The goal of the analysis is to decide if there is evidence that cloud seeding is effective in increasing rainfall. Begin your analysis by drawing appropriate graphs. Obtain appropriate transformations of predictors. FitTable 9.5 The Florida Area Cumulus Experiment on Cloud Seeding Variable Description Action: 1 = seed, 0 = do not seed Days after the first day of the experiment (June 16, 1975 = 0) Suitability for seeding Percentage cloud cover in the experimental area, measured using radar in Coral Gables, Florida Prewetness, amount of rainfall in the hour preceding seeding in 10 cubic meters Echo motion category, either 1 or 2, a measure of the type of cloud Rain Rainfall following the action of seeding or not seeding in 10' cubic meters Table 9.6 The Drug Cost Data Variable Description COST Average cost to plan for one prescription for one day, dollars RXPM Average number of prescriptions per member per year GS Percentage generic substitution used by the plan RI Restrictiveness index (0 = none, 100 = total) COPAY Average member copayment for prescriptions AGE Average member age F Percentage female members MM Member months, a measure of the size of the plan ID An identifier for the name of the plan appropriate mean functions and summarize your results. (Hint: Be sure to check for influential observations and outliers.)
Step by Step Solution
There are 3 Steps involved in it

Get step-by-step solutions from verified subject matter experts