

Question: Use random choices to simulate random behavior in an experiment Group data in an appropriate collection data structure such as a dictionary or list Use
Use random choices to simulate random behavior in an experiment
Group data in an appropriate collection data structure such as a dictionary or list
Use Python matplotlib to put visual information on a graph and save it to a file
Separate generating numerical results from visualizing results
Use loops to avoid repeated code in your solution when working with dictionaries and lists
Structure
Files:
random
walk.py
don
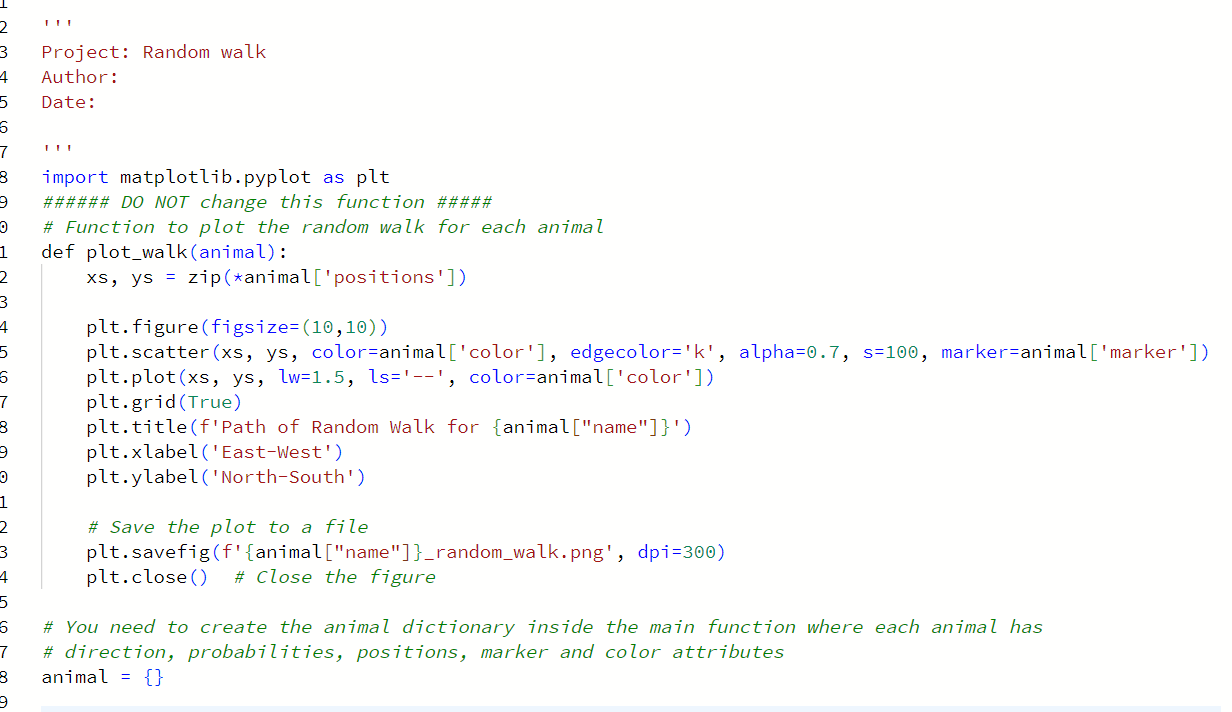
t modify function plot
walk that you are given
Output files:
Chuck
rw
png
Daisy
rw
png
Chester
rw
png
Background
In
the Scottish botanist Robert Brown observed that pollen particles suspended in water seemed to float around at random. He had no plausible explanation for what came to be known as Brownian motion, and made no attempt to model it mathematically. Louis Bachelier presented a clear mathematical model in his doctoral thesis, The Theory of Speculation in
His thesis was largely ignored by respectable academics because it dealt with the then disreputable field of understanding financial markets. In
Albert Einstein used similar stochastic thinking in physics to describe how it could be used to confirm the existence of atoms. People seemed to think that understanding physics was more important than making money, and the world started paying attention.
Brownian motion is an example of a random walk. Today, random walks are widely used to model physical processes like diffusion, biological processes like the kinetics of displacement of RNA from heteroduplexes by DNA, and social processes like movements of the stock market.
We are interested in random walks because of their wide applications to many problems, and for learning more about how to structure simulations nicely in Python.
Problem
Farmer John has three interesting pets: Chuck the chicken, Daisy the dog, and Chester the cat. Each of these animals has a different style of wandering around:
Chuck the chicken loves to wander randomly. Each second, he takes a step in a random direction: North, South, East, or West, with equal probabilities. Chuck
s marker in a graph is a blue circle.
Daisy the dog loves to explore but she has a slight preference for the North. Each second, she takes a step with the following probabilities: North
South
East
and West
Daisy
s marker in a graph is a red square.
Chester the cat is a peculiar feline who only moves East or West, never North or South. Chester
s marker is a green triangle.
Your task is to simulate the movement of each animal for
steps and plot their steps. Assume they always start at the barn door, which we will label
We give you code for a function plot
walk
animal
that you call to visualize an animal
s path using matplotlib. Do not modify this function, just call it
Key Requirements and Gradinig
While you might observe that certain rubrics are being automatically graded, please note that these scores will not be transferred to Canvas until your instructor or TA comprehensively reviews the entire project and manually assigns grades after the deadline ends.
Manually graded scoring
points
Chuck Daisy, and Chester move differently, each as described.
Each time you run the simulation, it produces randomly different output graphs
images for each animal.
Use dictionaries or lists to group information about each animal together.
The only global code allowed is the information about each animal.
All variable names and the code follows Python snake case or camelcase.
Automatically
graded scoring
points
Loops are used to avoid repeated code.
Program has a main function with conditional execution of main
Example plots
Below is shown example plots for each animal. Your plots should look similar to these, but are not expected to exactly match these ones. The location of
is different in each plot and that
s OK
Step by Step Solution
There are 3 Steps involved in it
1 Expert Approved Answer
Step: 1 Unlock

Question Has Been Solved by an Expert!
Get step-by-step solutions from verified subject matter experts
Step: 2 Unlock
Step: 3 Unlock