

Question: Use Raoult's law, Murphy Table B.4, and MATLAB to create: 1. A Pxy vapor-liquid phase diagram for an ethylene glycol - ethanolamine binary mixture at
Use Raoult's law, Murphy Table B.4, and MATLAB to create:
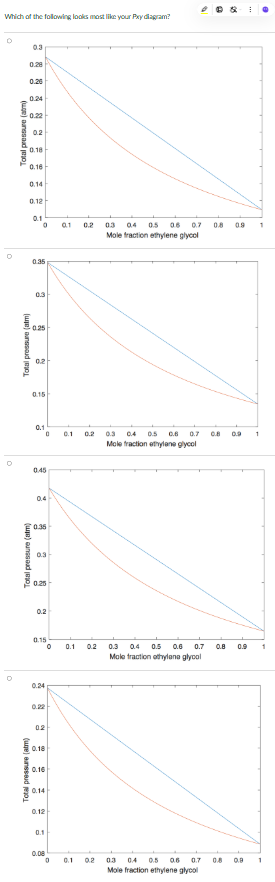
1. A Pxy vapor-liquid phase diagram for an ethylene glycol - ethanolamine binary mixture at 130oC.
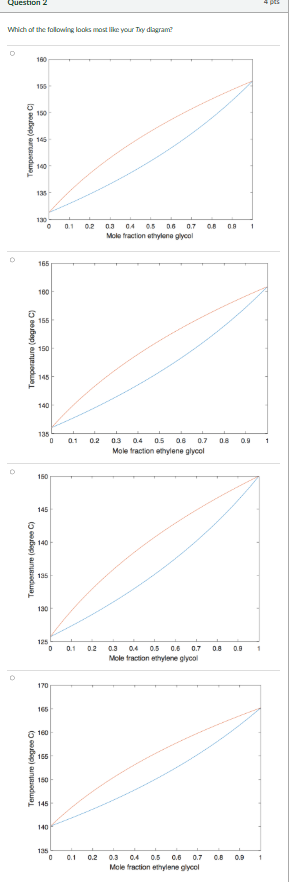
2. A Txy diagram at 0.30 atm for the same binary mixture.
There are certain requirements that must be satisfied in your code to be submitted(points will be deducted otherwise):
- Plot the two diagrams using the command "subplot(1, 2, 1)" and "subplot(1, 2, 2)" to plot them on the same popup window, with the first on the left and the second on the right.
- Name the vector for the overall mole fractions of ethylene glycol as "z"
- For plotting the Pxy diagram, name the dew point pressure vector as "P_dp" and the bubble point pressure vector as "P_bp".
- For plotting the Txy diagram, name the dew point temperature vector as "T_dp" and the bubble point temperature vector as "T_bp".
- The axes on the diagrams must be labelled (using the function "xlabel" and "ylabel")
Resume Quiz
Previous
Next
Step by Step Solution
There are 3 Steps involved in it
1 Expert Approved Answer
Step: 1 Unlock

Question Has Been Solved by an Expert!
Get step-by-step solutions from verified subject matter experts
Step: 2 Unlock
Step: 3 Unlock