

Question: Use Rstudio Dataset is in Rstudio Problem 4. Consider the arbuthnot.csv dataset. This dataset refers to Dr. John Arbuthnot who was interested in the ratio
Use Rstudio Dataset is in Rstudio
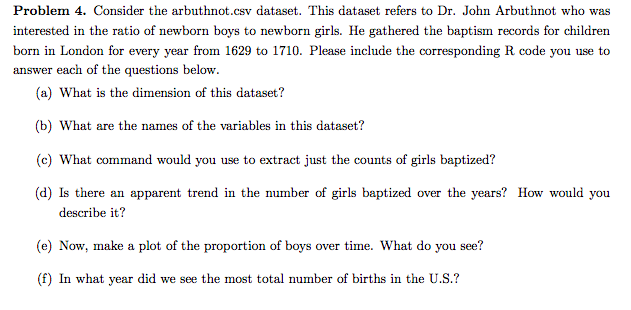
Problem 4. Consider the arbuthnot.csv dataset. This dataset refers to Dr. John Arbuthnot who was interested in the ratio of newborn boys to newborn girls. He gathered the baptism records for children born in London for every year from 1629 to 1710. Please include the corresponding R code you use to answer each of the questions below. (a) What is the dimension of this dataset? (b) What are the names of the variables in this dataset? (c) What command would you use to extract just the counts of girls baptized? (d) Is there an apparent trend in the number of girls baptized over the years? How would you describe it? (e) Now, make a plot of the proportion of boys over time. What do you see? (f) In what year did we see the most total number of births in the U.S.? Problem 4. Consider the arbuthnot.csv dataset. This dataset refers to Dr. John Arbuthnot who was interested in the ratio of newborn boys to newborn girls. He gathered the baptism records for children born in London for every year from 1629 to 1710. Please include the corresponding R code you use to answer each of the questions below. (a) What is the dimension of this dataset? (b) What are the names of the variables in this dataset? (c) What command would you use to extract just the counts of girls baptized? (d) Is there an apparent trend in the number of girls baptized over the years? How would you describe it? (e) Now, make a plot of the proportion of boys over time. What do you see? (f) In what year did we see the most total number of births in the U.S
Step by Step Solution
There are 3 Steps involved in it

Get step-by-step solutions from verified subject matter experts