

Question: Use R-Studio Programing to finish this: Create a scatterplot for age (y variable) and fl (x variable) with the following specifications: Limit of x axis
Use R-Studio Programing to finish this:
-
Create a scatterplot for age (y variable) and fl (x variable) with the following specifications:
-
Limit of x axis is (0,500)
-
Limit of y axis is (0,15)
-
Title of graph is Plot 1: Harrison Lake Trout
-
Y axis label is Age (yrs)
-
X axis label is Fork Length (mm)
-
Use a small filled circle for the plotted data points
-
Plot an Age histogram with the following specifications Y axis label is Frequency X axis label is Age (yrs) Title of the histogram is Plot 2: Harrison Fish Age Distribution
X and Y axis limits is 0, 15 The color of the frequency plots is cadetblue The color of the Title is cadetblue
-
Create an overdense plot using the same specifications as the previous scatterplot. But,
-
Title the plot Plot 3: Harrison Density Shaded by Era
-
Y axis label is Age (yrs)
-
Y axis limits are 0 to 15
-
X axis label is Fork Length (mm)
-
X axis limits are 0 to 500
-
include two levels of shading for the green data points.
-
Plot solid circles as data points
-
-
Create a new object called tmp that includes the first 3 and last 3 records of the BullTroutRML2 data set.
-
Display the era column (variable) in the new tmp object
-
Create a pchs vector with the argument values for + and x.
-
Create a cols vector with the two elements red and gray60
-
Convert the tmp era values to numeric values.
-
Initialize the cols vector with the tmp era values
-
Create a plot of Age (yrs) (y variable) versus Fork Length (mm) (x variable) with the
following specifications:
-
Title of graph is Plot 4: Symbol & Color by Era
-
Limit of x axis is (0,500)
-
Limit of y axis is (0,15)
-
X axis label is Age (yrs)
-
Y axis label is Fork Length (mm)
-
Set pch equal to pchs era values
-
Set col equal to cols era values
-
-
Plot a regression line overlay on Plot 4 and title the new graph Plot 5: Regression Overlay.
20. Place a legend of on Plot 5 and call the new graph Plot 6: :Legend Overlay
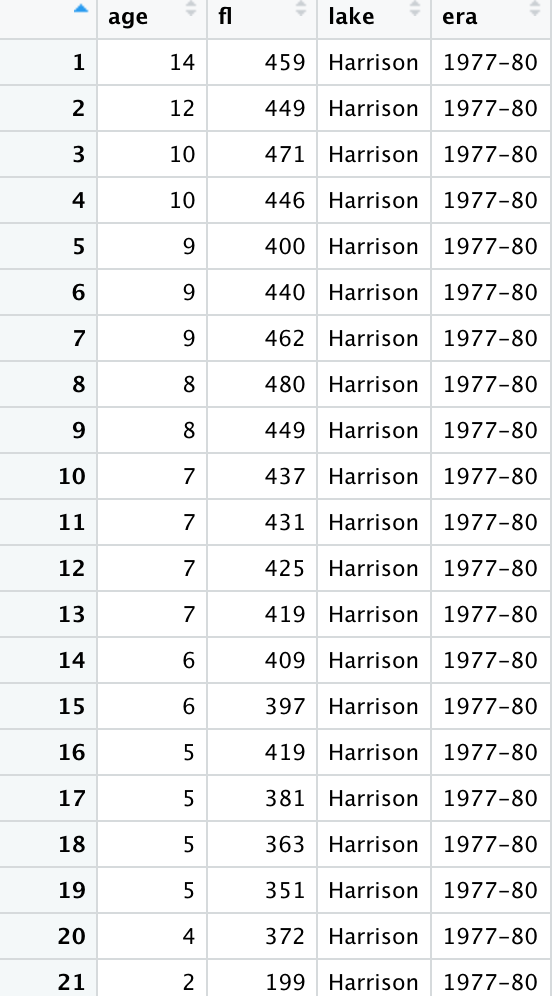
age fi lake era 1 14 459 Harrison 1977-80 2 12 449 Harrison 1977-80 3 10 471 Harrison 1977-80 4 10 446 Harrison 1977-80 5 9 400 Harrison 1977-80 6 9 440 Harrison 1977-80 7 9 462 Harrison 1977-80 8 8 480 Harrison 1977-80 9 8 449 Harrison 1977-80 10 7 437 Harrison 1977-80 11 7 431 Harrison 1977-80 12 7 425 Harrison 1977-80 13 7 419 Harrison 1977-80 14 6 409 Harrison 1977-80 15 6 397 Harrison 1977-80 16 5 419 Harrison 1977-80 17 5 381 Harrison 1977-80 18 5 363 Harrison 1977-80 19 5 351 Harrison 1977-80 20 4 372 Harrison 1977-80 21 2 199 Harrison 1977-80 age fi lake era 1 14 459 Harrison 1977-80 2 12 449 Harrison 1977-80 3 10 471 Harrison 1977-80 4 10 446 Harrison 1977-80 5 9 400 Harrison 1977-80 6 9 440 Harrison 1977-80 7 9 462 Harrison 1977-80 8 8 480 Harrison 1977-80 9 8 449 Harrison 1977-80 10 7 437 Harrison 1977-80 11 7 431 Harrison 1977-80 12 7 425 Harrison 1977-80 13 7 419 Harrison 1977-80 14 6 409 Harrison 1977-80 15 6 397 Harrison 1977-80 16 5 419 Harrison 1977-80 17 5 381 Harrison 1977-80 18 5 363 Harrison 1977-80 19 5 351 Harrison 1977-80 20 4 372 Harrison 1977-80 21 2 199 Harrison 1977-80
Step by Step Solution
There are 3 Steps involved in it

Get step-by-step solutions from verified subject matter experts