

Question: Use SAS or MINITAB or R for the data on page 202 (Table 4.12) (a). To predict the sale volume when X, = 20,000,
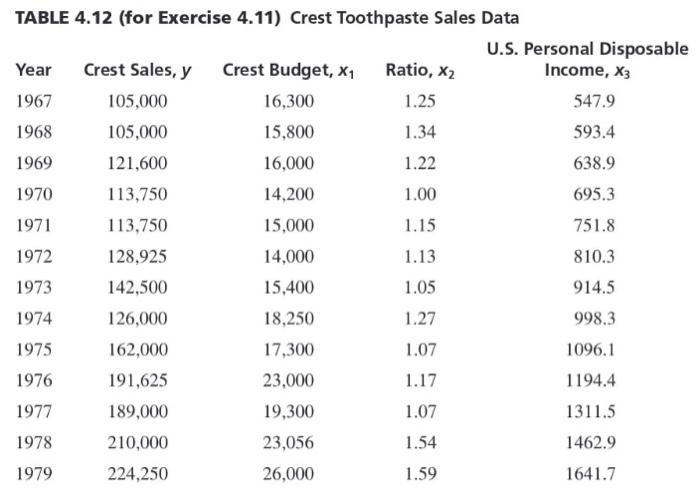
Use SAS or MINITAB or R for the data on page 202 (Table 4.12) (a). To predict the sale volume when X, = 20,000, X,= 1.7, X,- 500. (b). To construct the 95 % prediction interval for the sale volume when X, = 20,000, X,= 1.7, X,-500. (c). Check whether the predictor X, is needed by using a partial F test. %3D %3D %3D %3D TABLE 4.12 (for Exercise 4.11) Crest Toothpaste Sales Data U.S. Personal Disposable Year Crest Sales, y Crest Budget, x1 Ratio, X2 Income, X3 1967 105,000 16,300 1.25 547.9 1968 105,000 15,800 1.34 593.4 1969 121,600 16,000 1.22 638.9 1970 113,750 14,200 1.00 695.3 1971 113,750 15,000 1.15 751.8 1972 128,925 14,000 1.13 810.3 1973 142,500 15,400 1.05 914.5 1974 126,000 18,250 1.27 998.3 1975 162,000 17,300 1.07 1096.1 1976 191,625 23,000 1.17 1194.4 1977 189,000 19,300 1.07 1311.5 1978 210,000 23,056 1.54 1462.9 1979 224,250 26,000 1.59 1641.7
Step by Step Solution
3.46 Rating (153 Votes )
There are 3 Steps involved in it

Get step-by-step solutions from verified subject matter experts