

Question: use semilog graph paper to hand plot the data. 3 ) Drawdown measurements were carried out in an observation well 6 1 m from a
use semilog graph paper to hand plot the data.
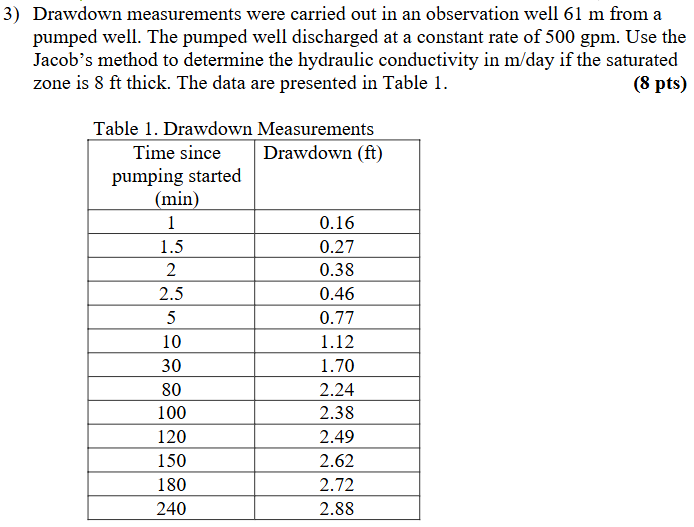
Drawdown measurements were carried out in an observation well m from a pumped well. The pumped well discharged at a constant rate of gpm Use the Jacob's method to determine the hydraulic conductivity in m day if the saturated zone is ft thick. The data are presented in Table
pts
Table Drawdown Measurements
begintabularcc
hline begintabularc
Time since
pumping started
mathrmmin
endtabular & Drawdown ft
hline &
hline &
hline &
hline &
hline &
hline &
hline &
hline &
hline &
hline &
hline &
hline &
hline &
hline
endtabular
Step by Step Solution
There are 3 Steps involved in it
1 Expert Approved Answer
Step: 1 Unlock

Question Has Been Solved by an Expert!
Get step-by-step solutions from verified subject matter experts
Step: 2 Unlock
Step: 3 Unlock