

Question: * Use Sensitivity analysis for project and Parent viewpoints (pp. 498-499) * Assignment Requirements: => Assume 10% Depreciated (Rp/$) Rupiah-to-Dollar exchange rate as compared to
* Use Sensitivity analysis for project and Parent viewpoints (pp. 498-499)
* Assignment Requirements:
=> Assume 10% Depreciated (Rp/$) Rupiah-to-Dollar exchange rate as compared to those shown in the case study
=> Assume sales volume to be 10% lower as compared to those shown in the case study
=> All other conditions remain the same as in text
=> Compute NPV and IRR under the above conditions w.r.t Project and Parent Viewpoints
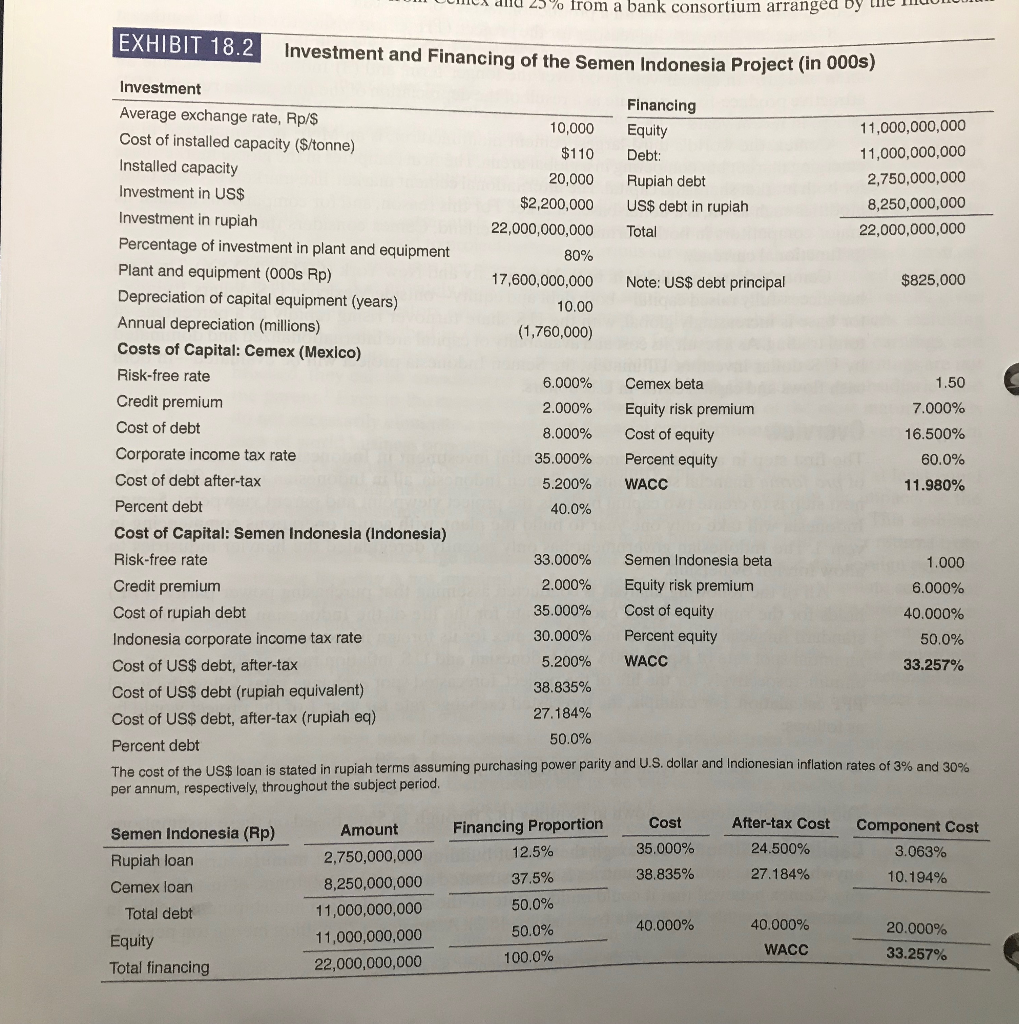
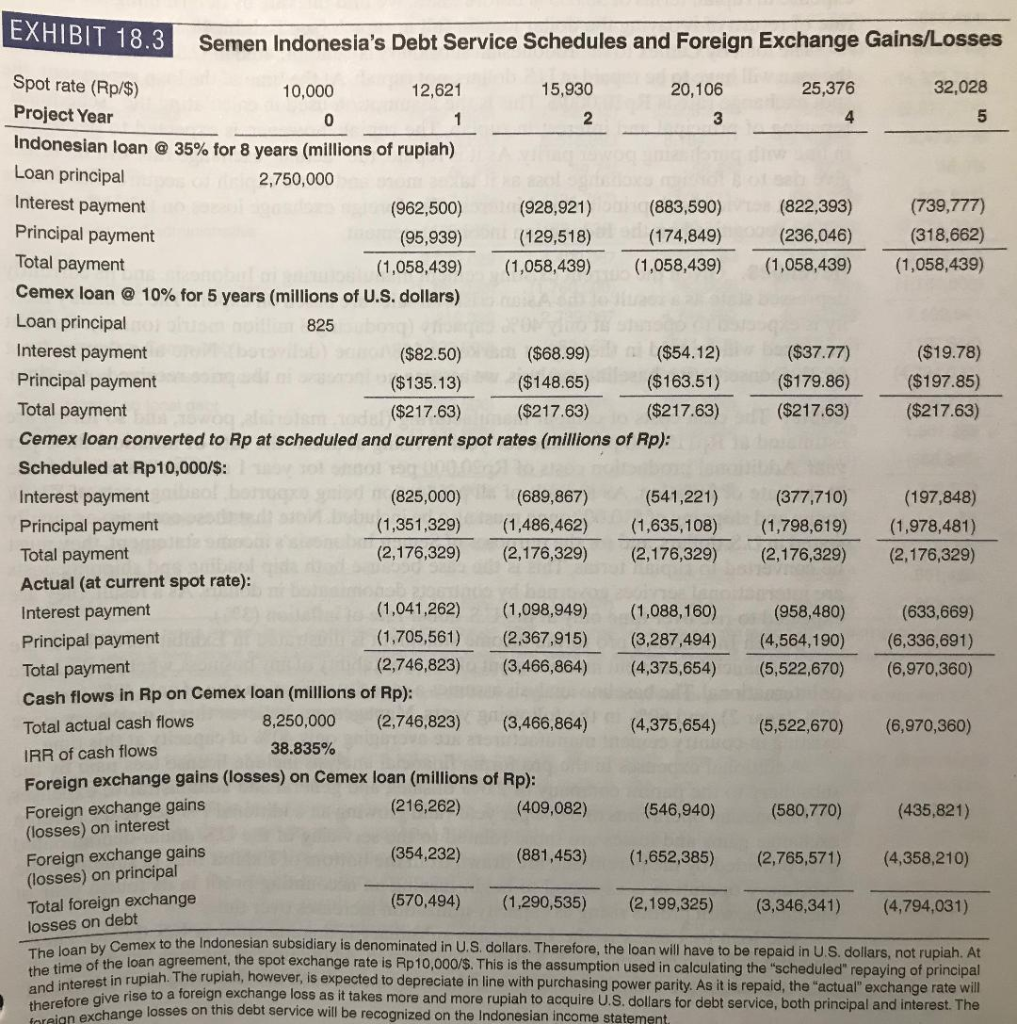
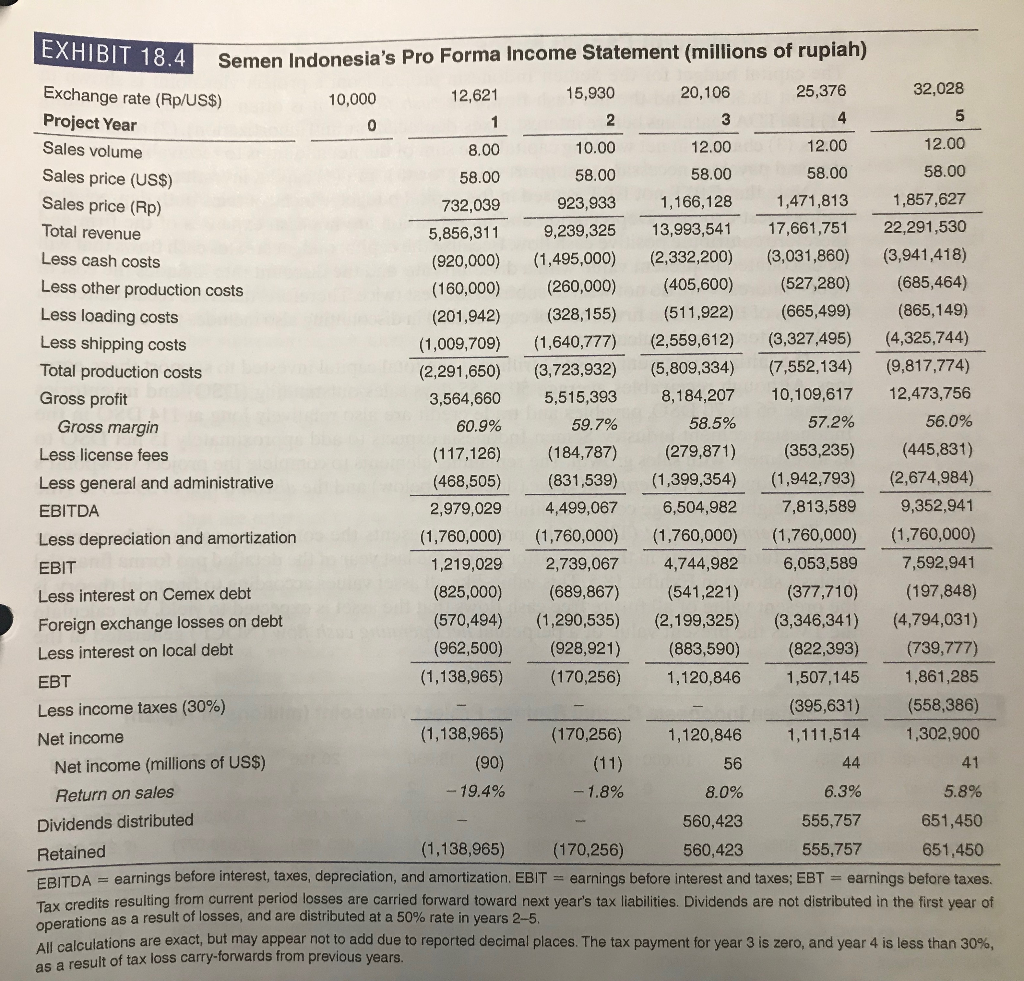
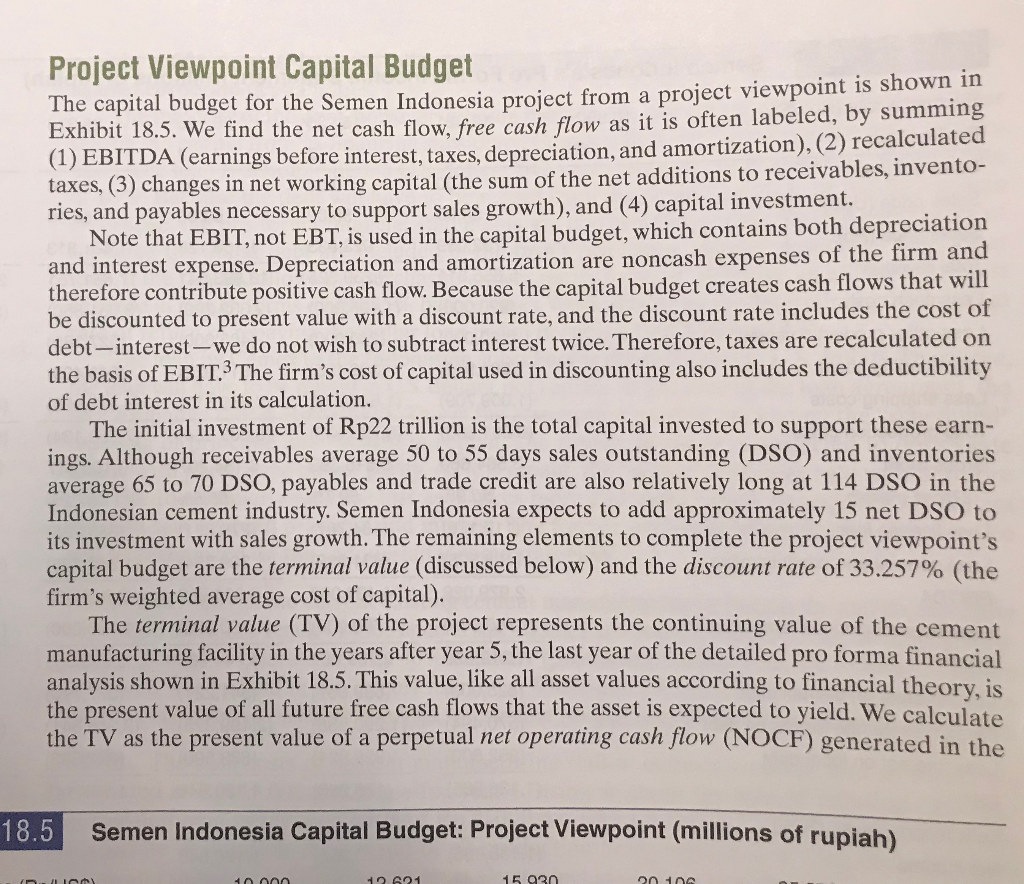
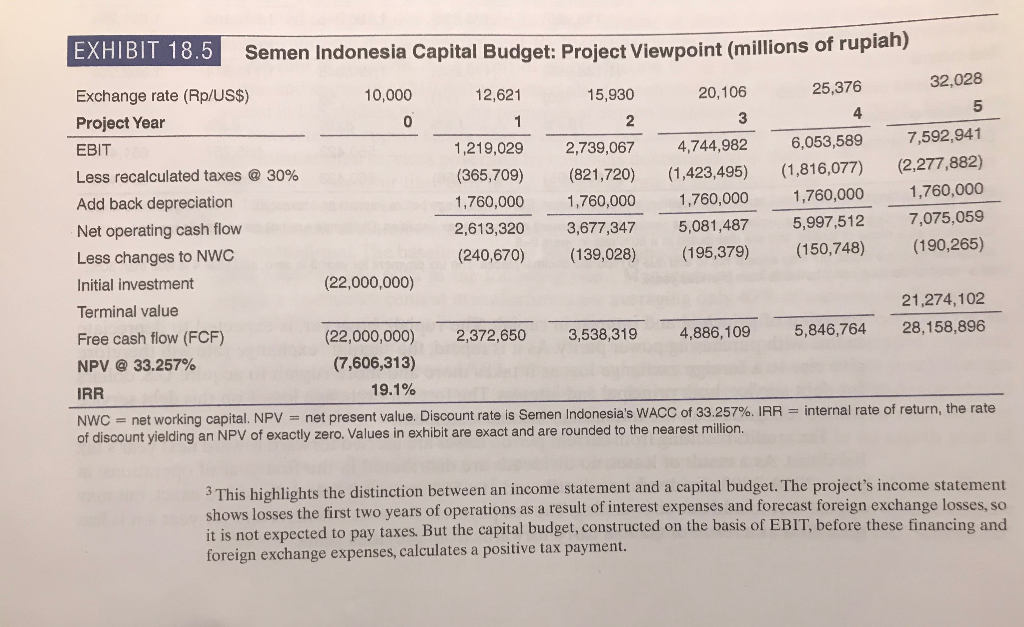
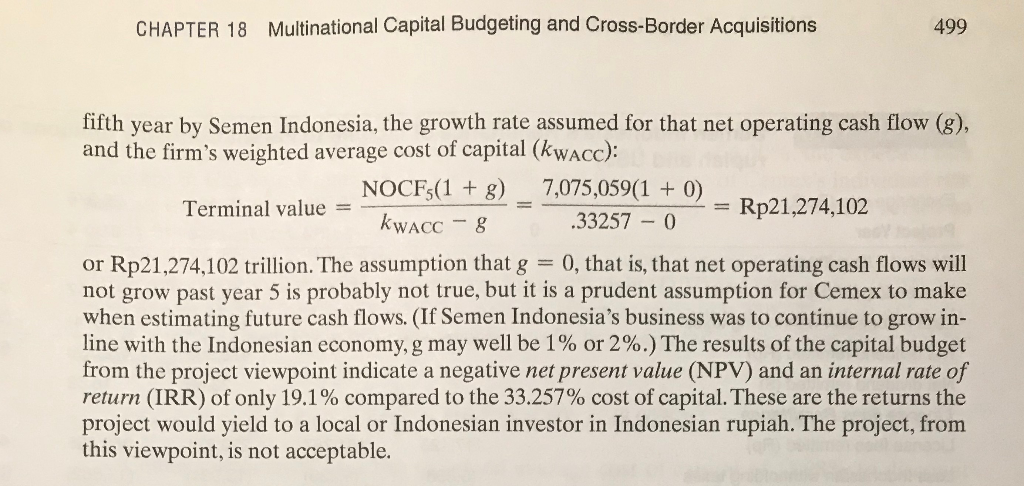

25 % from a bank consortium arranged by EXHIBIT 18.2 Investment and Financing of the Semen Indonesia Project (in 000s) Investment Financing Average exchange rate, Rp/$ 10,000 Equity 11,000,000,000 Cost of installed capacity ($/tonne) $110 Debt: 11,000,000,000 Installed capacity 20,000 Rupiah debt 2,750,000,000 Investment in US$ $2,200,000 US$ debt in rupiah 8,250,000,000 Investment in rupiah 22,000,000,000 Total 22,000,000,000 Percentage of investment in plant and equipment 80% Plant and equipment (000s Rp) 17,600,000,000 Note: US$ debt principal $825,000 Depreciation of capital equipment (years) 10.00 Annual depreciation (millions) (1,760,000) Costs of Capital: Cemex (Mexico) Risk-free rate 6.000% Cemex beta 1.50 Credit premium 2.000% Equity risk premium 7.000% Cost of debt 8.000% Cost of equity 16.500% Corporate income tax rate 35.000% Percent equity 60.0% Cost of debt after-tax 5.200% WACC 11.980% Percent debt 40.0% Cost of Capital: Semen Indonesia (Indonesia) Risk-free rate 33.000% Semen Indonesia beta 1.000 Credit premium 2.000% Equity risk premium 6.000% Cost of rupiah debt 35.000% Cost of equity 40.000% Indonesia corporate income tax rate 30.000% Percent equity 50.0% Cost of US$ debt, after-tax 5.200% WACC 33.257% Cost of US$ debt (rupiah equivalent) 38.835% Cost of US$ debt, after-tax (rupiah eq) 27.184% 50.0% Percent debt The cost of the US$ loan is stated in rupiah terms assuming purchasing power parity and U.S. dollar and Indionesian inflation rates of 3% and 30% per annum, respectively, throughout the subject period. Cost After-tax Cost Amount Semen Indonesia (Rp) Financing Proportion Component Cost 12.5% 2,750,000,000 35.000% 24.500% 3.063% Rupiah loan 37.5% 38.835% 27.184% 10.194% 8,250,000,000 Cemex loan 11,000,000,000 50.0% Total debt 40.000% 40.000% 50.0% 20.000% 11,000,000,000 Equity WACC 100.0% 33.257% Total financing 22,000,000,000 EXHIBIT 18.3 Semen Indonesia's Debt Service Schedules and Foreign Exchange Gains/Losses 25,376 32,028 4 5 (129,518) (822,393) (236,046) (1,058,439) (739,777) (318,662) (1,058,439) ($37.77) ($179.86) ($217.63) ($19.78) ($197.85) ($217.63) Spot rate (Rp/$) 10,000 12,621 15,930 20,106 Project Year 0 1 2 3 Indonesian loan @ 35% for 8 years (millions of rupiah) Loan principal 2,750,000 Interest payment (962,500) (928,921) (883,590) Principal payment (95,939) (174,849) Total payment (1,058,439) (1,058,439) (1,058,439) Cemex loan @ 10% for 5 years (millions of U.S. dollars) Loan principal 825 Interest payment ($82.50) ($68.99) ($54.12) Principal payment ($135.13) ($148.65) ($163.51) Total payment ($217.63) ($217.63) ($217.63) Cemex loan converted to Rp at scheduled and current spot rates (millions of Rp): Scheduled at Rp10,000/$: Interest payment (825,000) (689,867) (541,221) Principal payment (1,351,329) (1,486,462) (1,635,108) Total payment (2,176,329) (2,176,329) (2,176,329) Actual (at current spot rate): Interest payment (1,041,262) (1,098,949) (1,088,160) Principal payment (1,705,561) (2,367,915) (3,287,494) Total payment (2,746,823) (3,466,864) (4,375,654) Cash flows in Rp on Cemex loan (millions of Rp): Total actual cash flows 8,250,000 (2,746,823) (3,466,864) (4,375,654) 38.835% IRR of cash flows Foreign exchange gains (losses) on Cemex loan (millions of Rp): (216,262) Foreign exchange gains (409,082) (546,940) (377,710) (1,798,619) (2,176,329) (197,848) (1,978,481) (2,176,329) (958,480) (4,564,190) (5,522,670) (633,669) (6,336,691) (6,970,360) (5,522,670) (6,970,360) (580,770) (435,821) (354,232) (881,453) (1,652,385) (2,765,571) (4,358,210) (losses) on interest Foreign exchange gains (losses) on principal Total foreign exchange losses on debt (570,494) (1,290,535) (2.199,325) (3,346,341) (4,794,031) The loan by Cemex to the Indonesian subsidiary is denominated in US dollars. Therefore, the loan will have to be repaid in US dollars, not rupiah Al The time of the loan agreement, the spot exchange rate is Rp10,000/. This is the assumption used in calculating the scheduled" repaying of principal thed interest in rupiah. The rupiah, however, is expected to depreciate in line with purchasing power parity . As it is repaid, the "actual" exchange rate will therefore give rise to a foreignis bonserviss as it takes more and more rupiah to acquire U.S. dollars for debt service, both principal and interest. The theeign exchange losses on this debt service will be recognized on the Indonesian income statement EXHIBIT 18.4 Semen Indonesia's Pro Forma Income Statement (millions of rupiah) 12,621 Exchange rate (Rp/US$) 10,000 15,930 20,106 32,028 25,376 Project Year 1 2 0 3 4 5 Sales volume 8.00 10.00 12.00 12.00 12.00 Sales price (US$) 58.00 58.00 58.00 58.00 58.00 Sales price (Rp) 732,039 923,933 1,166,128 1,471,813 1,857,627 Total revenue 5,856,311 9,239,325 13,993,541 17,661,751 22,291,530 Less cash costs (920,000) (1,495,000) (2,332,200) (3,031,860) (3,941,418) Less other production costs (160,000) (260,000) (405,600) (527,280) (685,464) Less loading costs (201,942) (328,155) (511,922) (665,499) (865,149) Less shipping costs (1,009,709) (1,640,777) (2,559,612) (3,327,495) (4,325,744) Total production costs (2,291,650) (3,723,932) (5,809,334) (7,552,134) (9,817,774) Gross profit 3,564,660 5,515,393 8,184,207 10,109,617 12,473,756 Gross margin 60.9% 59.7% 58.5% 57.2% 56.0% Less license fees (117,126) (184,787) (279,871) (353,235) (445,831) Less general and administrative (468,505) (831,539) (1,399,354) (1,942,793) (2,674,984) EBITDA 2,979,029 4,499,067 6,504,982 7,813,589 9,352,941 Less depreciation and amortization (1,760,000) (1,760,000) (1,760,000) (1,760,000) (1,760,000) EBIT 1,219,029 2,739,067 4,744,982 6,053,589 7,592,941 Less interest on Cemex debt (825,000) (689,867) (541,221) (377,710) (197,848) Foreign exchange losses on debt (570,494) (1,290,535) (2,199,325) (3,346,341) (4,794,031) Less interest on local debt (962,500) (928,921) (883,590) (822,393) (739,777) EBT (1,138,965) (170,256) 1,120,846 1,507,145 1,861,285 Less income taxes (30%) (395,631) (558,386) Net income (1,138,965) (170,256) 1,120,846 1,111,514 1,302,900 Net income (millions of US$) (90) (11) 56 44 41 Return on sales - 19.4% -1.8% 8.0% 6.3% 5.8% Dividends distributed 560,423 555,757 651,450 Retained (1,138,965) (170,256) 560,423 555,757 651,450 EBITDA = earnings before interest, taxes, depreciation, and amortization. EBIT = earnings before interest and taxes; EBT = earnings before taxes. Tax credits resulting from current period losses are carried forward toward next year's tax liabilities. Dividends are not distributed in the first year of operations as a result of losses, and are distributed at a 50% rate in years 2-5, All calculations are exact, but may appear not to add due to reported decimal places. The tax payment for year 3 is zero, and year 4 is less than 30%, as a result of tax loss carry-forwards from previous years. Project Viewpoint Capital Budget The capital budget for the Semen Indonesia project from a project viewpoint is shown in Exhibit 18.5. We find the net cash flow, free cash flow as it is often labeled, by summing (1) EBITDA (earnings before interest, taxes, depreciation, and amortization), (2) recalculated taxes, (3) changes in net working capital (the sum of the net additions to receivables, invento- ries, and payables necessary to support sales growth), and (4) capital investment. Note that EBIT, not EBT, is used in the capital budget, which contains both depreciation and interest expense. Depreciation and amortization are noncash expenses of the firm and therefore contribute positive cash flow. Because the capital budget creates cash flows that will be discounted to present value with a discount rate, and the discount rate includes the cost of debt-interest - we do not wish to subtract interest twice. Therefore, taxes are recalculated on the basis of EBIT.3 The firm's cost of capital used in discounting also includes the deductibility of debt interest in its calculation. The initial investment of Rp22 trillion is the total capital invested to support these earn- ings. Although receivables average 50 to 55 days sales outstanding (DSO) and inventories average 65 to 70 DSO, payables and trade credit are also relatively long at 114 DSO in the Indonesian cement industry. Semen Indonesia expects to add approximately 15 net DSO to its investment with sales growth. The remaining elements to complete the project viewpoint's capital budget are the terminal value (discussed below) and the discount rate of 33.257% (the firm's weighted average cost of capital). The terminal value (TV) of the project represents the continuing value of the cement manufacturing facility in the years after year 5, the last year of the detailed pro forma financial analysis shown in Exhibit 18.5. This value, like all asset values according to financial theory, is the present value of all future free cash flows that the asset is expected to yield. We calculate the TV as the present value of a perpetual net operating cash flow (NOCF) generated in the 18.5 Semen Indonesia Capital Budget: Project Viewpoint (millions of rupiah) 12601 15 930 2010 CHAPTER 18 Multinational Capital Budgeting and Cross-Border Acquisitions 499 fifth year by Semen Indonesia, the growth rate assumed for that net operating cash flow (8), and the firm's weighted average cost of capital (kwacc): NOCF5(1 + 8) 7,075,059(1 + 0) Terminal value = Rp21,274,102 kwacc .33257 - 0 or Rp21,274,102 trillion. The assumption that g = 0, that is, that net operating cash flows will not grow past year 5 is probably not true, but it is a prudent assumption for Cemex to make when estimating future cash flows. (If Semen Indonesia's business was to continue to grow in- line with the Indonesian economy, g may well be 1% or 2%.) The results of the capital budget from the project viewpoint indicate a negative net present value (NPV) and an internal rate of return (IRR) of only 19.1% compared to the 33.257% cost of capital. These are the returns the project would yield to a local or Indonesian investor in Indonesian rupiah. The project, from this viewpoint, is not acceptable. Project Viewpoint Capital Budget The capital budget for the Semen Indonesia project from a project viewpoint is shown in Exhibit 18.5. We find the net cash flow, free cash flow as it is often labeled, by summing (1) EBITDA (earnings before interest, taxes, depreciation, and amortization), (2) recalculated taxes, (3) changes in net working capital (the sum of the net additions to receivables, invento- ries, and payables necessary to support sales growth), and (4) capital investment. Note that EBIT, not EBT, is used in the capital budget, which contains both depreciation and interest expense. Depreciation and amortization are noncash expenses of the firm and therefore contribute positive cash flow. Because the capital budget creates cash flows that will be discounted to present value with a discount rate, and the discount rate includes the cost of debt-interest - we do not wish to subtract interest twice. Therefore, taxes are recalculated on the basis of EBIT.3 The firm's cost of capital used in discounting also includes the deductibility of debt interest in its calculation. The initial investment of Rp22 trillion is the total capital invested to support these earn- ings. Although receivables average 50 to 55 days sales outstanding (DSO) and inventories average 65 to 70 DSO, payables and trade credit are also relatively long at 114 DSO in the Indonesian cement industry. Semen Indonesia expects to add approximately 15 net DSO to its investment with sales growth. The remaining elements to complete the project viewpoint's capital budget are the terminal value (discussed below) and the discount rate of 33.257% (the firm's weighted average cost of capital). The terminal value (TV) of the project represents the continuing value of the cement manufacturing facility in the years after year 5, the last year of the detailed pro forma financial analysis shown in Exhibit 18.5. This value, like all asset values according to financial theory, is the present value of all future free cash flows that the asset is expected to yield. We calculate the TV as the present value of a perpetual net operating cash flow (NOCF) generated in the 18.5 Semen Indonesia Capital Budget: Project Viewpoint (millions of rupiah) 12601 15 930 2010 25 % from a bank consortium arranged by EXHIBIT 18.2 Investment and Financing of the Semen Indonesia Project (in 000s) Investment Financing Average exchange rate, Rp/$ 10,000 Equity 11,000,000,000 Cost of installed capacity ($/tonne) $110 Debt: 11,000,000,000 Installed capacity 20,000 Rupiah debt 2,750,000,000 Investment in US$ $2,200,000 US$ debt in rupiah 8,250,000,000 Investment in rupiah 22,000,000,000 Total 22,000,000,000 Percentage of investment in plant and equipment 80% Plant and equipment (000s Rp) 17,600,000,000 Note: US$ debt principal $825,000 Depreciation of capital equipment (years) 10.00 Annual depreciation (millions) (1,760,000) Costs of Capital: Cemex (Mexico) Risk-free rate 6.000% Cemex beta 1.50 Credit premium 2.000% Equity risk premium 7.000% Cost of debt 8.000% Cost of equity 16.500% Corporate income tax rate 35.000% Percent equity 60.0% Cost of debt after-tax 5.200% WACC 11.980% Percent debt 40.0% Cost of Capital: Semen Indonesia (Indonesia) Risk-free rate 33.000% Semen Indonesia beta 1.000 Credit premium 2.000% Equity risk premium 6.000% Cost of rupiah debt 35.000% Cost of equity 40.000% Indonesia corporate income tax rate 30.000% Percent equity 50.0% Cost of US$ debt, after-tax 5.200% WACC 33.257% Cost of US$ debt (rupiah equivalent) 38.835% Cost of US$ debt, after-tax (rupiah eq) 27.184% 50.0% Percent debt The cost of the US$ loan is stated in rupiah terms assuming purchasing power parity and U.S. dollar and Indionesian inflation rates of 3% and 30% per annum, respectively, throughout the subject period. Cost After-tax Cost Amount Semen Indonesia (Rp) Financing Proportion Component Cost 12.5% 2,750,000,000 35.000% 24.500% 3.063% Rupiah loan 37.5% 38.835% 27.184% 10.194% 8,250,000,000 Cemex loan 11,000,000,000 50.0% Total debt 40.000% 40.000% 50.0% 20.000% 11,000,000,000 Equity WACC 100.0% 33.257% Total financing 22,000,000,000 EXHIBIT 18.3 Semen Indonesia's Debt Service Schedules and Foreign Exchange Gains/Losses 25,376 32,028 4 5 (129,518) (822,393) (236,046) (1,058,439) (739,777) (318,662) (1,058,439) ($37.77) ($179.86) ($217.63) ($19.78) ($197.85) ($217.63) Spot rate (Rp/$) 10,000 12,621 15,930 20,106 Project Year 0 1 2 3 Indonesian loan @ 35% for 8 years (millions of rupiah) Loan principal 2,750,000 Interest payment (962,500) (928,921) (883,590) Principal payment (95,939) (174,849) Total payment (1,058,439) (1,058,439) (1,058,439) Cemex loan @ 10% for 5 years (millions of U.S. dollars) Loan principal 825 Interest payment ($82.50) ($68.99) ($54.12) Principal payment ($135.13) ($148.65) ($163.51) Total payment ($217.63) ($217.63) ($217.63) Cemex loan converted to Rp at scheduled and current spot rates (millions of Rp): Scheduled at Rp10,000/$: Interest payment (825,000) (689,867) (541,221) Principal payment (1,351,329) (1,486,462) (1,635,108) Total payment (2,176,329) (2,176,329) (2,176,329) Actual (at current spot rate): Interest payment (1,041,262) (1,098,949) (1,088,160) Principal payment (1,705,561) (2,367,915) (3,287,494) Total payment (2,746,823) (3,466,864) (4,375,654) Cash flows in Rp on Cemex loan (millions of Rp): Total actual cash flows 8,250,000 (2,746,823) (3,466,864) (4,375,654) 38.835% IRR of cash flows Foreign exchange gains (losses) on Cemex loan (millions of Rp): (216,262) Foreign exchange gains (409,082) (546,940) (377,710) (1,798,619) (2,176,329) (197,848) (1,978,481) (2,176,329) (958,480) (4,564,190) (5,522,670) (633,669) (6,336,691) (6,970,360) (5,522,670) (6,970,360) (580,770) (435,821) (354,232) (881,453) (1,652,385) (2,765,571) (4,358,210) (losses) on interest Foreign exchange gains (losses) on principal Total foreign exchange losses on debt (570,494) (1,290,535) (2.199,325) (3,346,341) (4,794,031) The loan by Cemex to the Indonesian subsidiary is denominated in US dollars. Therefore, the loan will have to be repaid in US dollars, not rupiah Al The time of the loan agreement, the spot exchange rate is Rp10,000/. This is the assumption used in calculating the scheduled" repaying of principal thed interest in rupiah. The rupiah, however, is expected to depreciate in line with purchasing power parity . As it is repaid, the "actual" exchange rate will therefore give rise to a foreignis bonserviss as it takes more and more rupiah to acquire U.S. dollars for debt service, both principal and interest. The theeign exchange losses on this debt service will be recognized on the Indonesian income statement EXHIBIT 18.4 Semen Indonesia's Pro Forma Income Statement (millions of rupiah) 12,621 Exchange rate (Rp/US$) 10,000 15,930 20,106 32,028 25,376 Project Year 1 2 0 3 4 5 Sales volume 8.00 10.00 12.00 12.00 12.00 Sales price (US$) 58.00 58.00 58.00 58.00 58.00 Sales price (Rp) 732,039 923,933 1,166,128 1,471,813 1,857,627 Total revenue 5,856,311 9,239,325 13,993,541 17,661,751 22,291,530 Less cash costs (920,000) (1,495,000) (2,332,200) (3,031,860) (3,941,418) Less other production costs (160,000) (260,000) (405,600) (527,280) (685,464) Less loading costs (201,942) (328,155) (511,922) (665,499) (865,149) Less shipping costs (1,009,709) (1,640,777) (2,559,612) (3,327,495) (4,325,744) Total production costs (2,291,650) (3,723,932) (5,809,334) (7,552,134) (9,817,774) Gross profit 3,564,660 5,515,393 8,184,207 10,109,617 12,473,756 Gross margin 60.9% 59.7% 58.5% 57.2% 56.0% Less license fees (117,126) (184,787) (279,871) (353,235) (445,831) Less general and administrative (468,505) (831,539) (1,399,354) (1,942,793) (2,674,984) EBITDA 2,979,029 4,499,067 6,504,982 7,813,589 9,352,941 Less depreciation and amortization (1,760,000) (1,760,000) (1,760,000) (1,760,000) (1,760,000) EBIT 1,219,029 2,739,067 4,744,982 6,053,589 7,592,941 Less interest on Cemex debt (825,000) (689,867) (541,221) (377,710) (197,848) Foreign exchange losses on debt (570,494) (1,290,535) (2,199,325) (3,346,341) (4,794,031) Less interest on local debt (962,500) (928,921) (883,590) (822,393) (739,777) EBT (1,138,965) (170,256) 1,120,846 1,507,145 1,861,285 Less income taxes (30%) (395,631) (558,386) Net income (1,138,965) (170,256) 1,120,846 1,111,514 1,302,900 Net income (millions of US$) (90) (11) 56 44 41 Return on sales - 19.4% -1.8% 8.0% 6.3% 5.8% Dividends distributed 560,423 555,757 651,450 Retained (1,138,965) (170,256) 560,423 555,757 651,450 EBITDA = earnings before interest, taxes, depreciation, and amortization. EBIT = earnings before interest and taxes; EBT = earnings before taxes. Tax credits resulting from current period losses are carried forward toward next year's tax liabilities. Dividends are not distributed in the first year of operations as a result of losses, and are distributed at a 50% rate in years 2-5, All calculations are exact, but may appear not to add due to reported decimal places. The tax payment for year 3 is zero, and year 4 is less than 30%, as a result of tax loss carry-forwards from previous years. Project Viewpoint Capital Budget The capital budget for the Semen Indonesia project from a project viewpoint is shown in Exhibit 18.5. We find the net cash flow, free cash flow as it is often labeled, by summing (1) EBITDA (earnings before interest, taxes, depreciation, and amortization), (2) recalculated taxes, (3) changes in net working capital (the sum of the net additions to receivables, invento- ries, and payables necessary to support sales growth), and (4) capital investment. Note that EBIT, not EBT, is used in the capital budget, which contains both depreciation and interest expense. Depreciation and amortization are noncash expenses of the firm and therefore contribute positive cash flow. Because the capital budget creates cash flows that will be discounted to present value with a discount rate, and the discount rate includes the cost of debt-interest - we do not wish to subtract interest twice. Therefore, taxes are recalculated on the basis of EBIT.3 The firm's cost of capital used in discounting also includes the deductibility of debt interest in its calculation. The initial investment of Rp22 trillion is the total capital invested to support these earn- ings. Although receivables average 50 to 55 days sales outstanding (DSO) and inventories average 65 to 70 DSO, payables and trade credit are also relatively long at 114 DSO in the Indonesian cement industry. Semen Indonesia expects to add approximately 15 net DSO to its investment with sales growth. The remaining elements to complete the project viewpoint's capital budget are the terminal value (discussed below) and the discount rate of 33.257% (the firm's weighted average cost of capital). The terminal value (TV) of the project represents the continuing value of the cement manufacturing facility in the years after year 5, the last year of the detailed pro forma financial analysis shown in Exhibit 18.5. This value, like all asset values according to financial theory, is the present value of all future free cash flows that the asset is expected to yield. We calculate the TV as the present value of a perpetual net operating cash flow (NOCF) generated in the 18.5 Semen Indonesia Capital Budget: Project Viewpoint (millions of rupiah) 12601 15 930 2010 CHAPTER 18 Multinational Capital Budgeting and Cross-Border Acquisitions 499 fifth year by Semen Indonesia, the growth rate assumed for that net operating cash flow (8), and the firm's weighted average cost of capital (kwacc): NOCF5(1 + 8) 7,075,059(1 + 0) Terminal value = Rp21,274,102 kwacc .33257 - 0 or Rp21,274,102 trillion. The assumption that g = 0, that is, that net operating cash flows will not grow past year 5 is probably not true, but it is a prudent assumption for Cemex to make when estimating future cash flows. (If Semen Indonesia's business was to continue to grow in- line with the Indonesian economy, g may well be 1% or 2%.) The results of the capital budget from the project viewpoint indicate a negative net present value (NPV) and an internal rate of return (IRR) of only 19.1% compared to the 33.257% cost of capital. These are the returns the project would yield to a local or Indonesian investor in Indonesian rupiah. The project, from this viewpoint, is not acceptable. Project Viewpoint Capital Budget The capital budget for the Semen Indonesia project from a project viewpoint is shown in Exhibit 18.5. We find the net cash flow, free cash flow as it is often labeled, by summing (1) EBITDA (earnings before interest, taxes, depreciation, and amortization), (2) recalculated taxes, (3) changes in net working capital (the sum of the net additions to receivables, invento- ries, and payables necessary to support sales growth), and (4) capital investment. Note that EBIT, not EBT, is used in the capital budget, which contains both depreciation and interest expense. Depreciation and amortization are noncash expenses of the firm and therefore contribute positive cash flow. Because the capital budget creates cash flows that will be discounted to present value with a discount rate, and the discount rate includes the cost of debt-interest - we do not wish to subtract interest twice. Therefore, taxes are recalculated on the basis of EBIT.3 The firm's cost of capital used in discounting also includes the deductibility of debt interest in its calculation. The initial investment of Rp22 trillion is the total capital invested to support these earn- ings. Although receivables average 50 to 55 days sales outstanding (DSO) and inventories average 65 to 70 DSO, payables and trade credit are also relatively long at 114 DSO in the Indonesian cement industry. Semen Indonesia expects to add approximately 15 net DSO to its investment with sales growth. The remaining elements to complete the project viewpoint's capital budget are the terminal value (discussed below) and the discount rate of 33.257% (the firm's weighted average cost of capital). The terminal value (TV) of the project represents the continuing value of the cement manufacturing facility in the years after year 5, the last year of the detailed pro forma financial analysis shown in Exhibit 18.5. This value, like all asset values according to financial theory, is the present value of all future free cash flows that the asset is expected to yield. We calculate the TV as the present value of a perpetual net operating cash flow (NOCF) generated in the 18.5 Semen Indonesia Capital Budget: Project Viewpoint (millions of rupiah) 12601 15 930 2010
Step by Step Solution
There are 3 Steps involved in it

Get step-by-step solutions from verified subject matter experts