

Question: Use separate graphs as needed. Explain your graph in detail and d iscuss how the two financial measures relate. i. Cumulative Revenue ii. Weekly Net
Use separate graphs as needed.
Explain your graph in detail and discuss how the two financial measures relate.
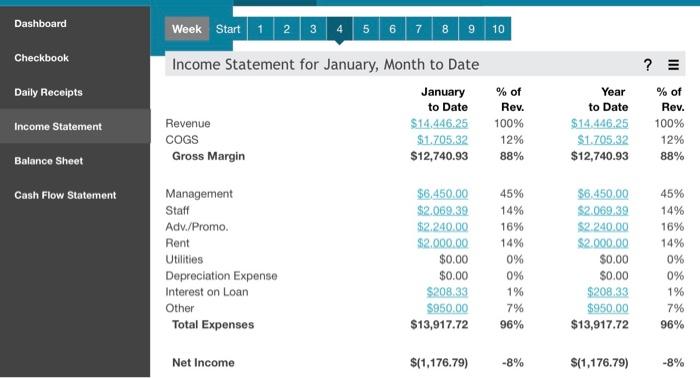
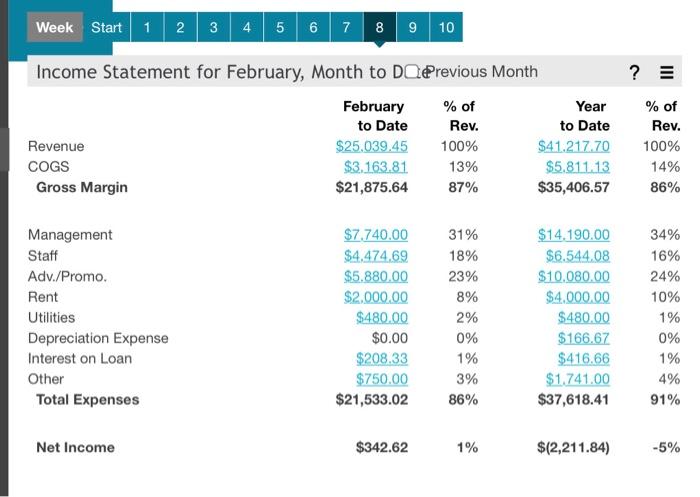
Dashboard Checkbook ? Daily Receipts Week Start 1 2 3 4 5 6 7 8 9 10 Income Statement for January, Month to Date January % of to Date Rev. Revenue $14.446.25 100% COGS $1.705.32 Gross Margin $12,740.93 88% Income Statement Year to Date $14,446.25 $1.70532 $12,740.93 % of Rev. 100% 12% 88% 12% Balance Sheet Cash Flow Statement Management Staff Adv./Promo. Rent Utilities Depreciation Expense Interest on Loan Other Total Expenses $6,450.00 $2.069.39 $2.240.00 $2.000.00 $0.00 $0.00 $208.33 $950.00 $13,917.72 45% 14% 16% 14% 0% 0% 1% 7% 96% $6,450,00 $2.069.39 $2.240.00 $2.000.00 $0.00 $0.00 $208.33 $950.00 $13,917.72 45% 14% 16% 14% 0% 0% 1% 7% 96% Net Income $(1,176.79) -8% $(1,176.79) -8% Week Start 1 2 3 4 5 6 7 8 9 10 ? Income Statement for February, Month to Do Previous Month February % of Year to Date Rev. to Date Revenue $25.039.45 100% $41.217.70 COGS $3.163.81 13% $5.811.13 Gross Margin $21,875.64 87% $35,406.57 % of Rev. 100% 14% 86% Management Staff Adv./Promo. Rent Utilities Depreciation Expense Interest on Loan Other Total Expenses $7.740.00 $4,474,69 $5.880.00 $2.000.00 $480.00 $0.00 $208.33 $750.00 $21,533.02 31% 18% 23% 8% 2% 0% 1% 3% 86% $14.190.00 $6.544.08 $10,080.00 $4.000.00 $480.00 $166.67 $416.66 $1,741.00 $37,618.41 34% 16% 24% 10% 1% 0% 1% 4% 91% Net Income $342.62 1% $(2,211.84) -5% Dashboard Checkbook ? Daily Receipts Week Start 1 2 3 4 5 6 7 8 9 10 Income Statement for January, Month to Date January % of to Date Rev. Revenue $14.446.25 100% COGS $1.705.32 Gross Margin $12,740.93 88% Income Statement Year to Date $14,446.25 $1.70532 $12,740.93 % of Rev. 100% 12% 88% 12% Balance Sheet Cash Flow Statement Management Staff Adv./Promo. Rent Utilities Depreciation Expense Interest on Loan Other Total Expenses $6,450.00 $2.069.39 $2.240.00 $2.000.00 $0.00 $0.00 $208.33 $950.00 $13,917.72 45% 14% 16% 14% 0% 0% 1% 7% 96% $6,450,00 $2.069.39 $2.240.00 $2.000.00 $0.00 $0.00 $208.33 $950.00 $13,917.72 45% 14% 16% 14% 0% 0% 1% 7% 96% Net Income $(1,176.79) -8% $(1,176.79) -8% Week Start 1 2 3 4 5 6 7 8 9 10 ? Income Statement for February, Month to Do Previous Month February % of Year to Date Rev. to Date Revenue $25.039.45 100% $41.217.70 COGS $3.163.81 13% $5.811.13 Gross Margin $21,875.64 87% $35,406.57 % of Rev. 100% 14% 86% Management Staff Adv./Promo. Rent Utilities Depreciation Expense Interest on Loan Other Total Expenses $7.740.00 $4,474,69 $5.880.00 $2.000.00 $480.00 $0.00 $208.33 $750.00 $21,533.02 31% 18% 23% 8% 2% 0% 1% 3% 86% $14.190.00 $6.544.08 $10,080.00 $4.000.00 $480.00 $166.67 $416.66 $1,741.00 $37,618.41 34% 16% 24% 10% 1% 0% 1% 4% 91% Net Income $342.62 1% $(2,211.84) -5%
Step by Step Solution
There are 3 Steps involved in it

Get step-by-step solutions from verified subject matter experts