

Question: Use Sheet 3 of the Excel file to answer the following questions. A school administrator believes that the mean class GPAs for a given course
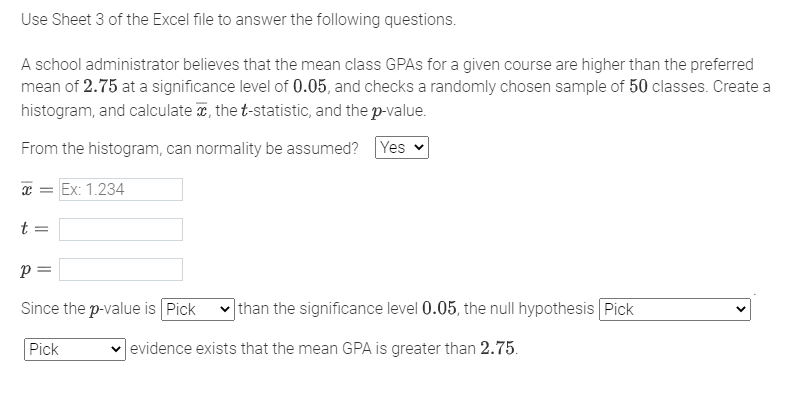
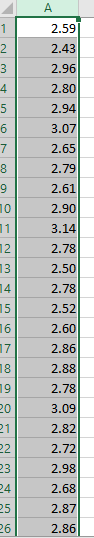
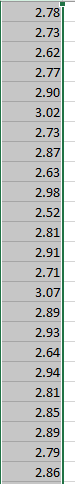
Use Sheet 3 of the Excel file to answer the following questions. A school administrator believes that the mean class GPAs for a given course are higher than the preferred mean of 2.75 at a significance level of 0.05, and checks a randomly chosen sample of 50 classes. Create a histogram, and calculate , the t-statistic, and the p-value. From the histogram, can normality be assumed? Yes v T = Ex: 1.234 t = P Since the p-value is Pick than the significance level 0.05, the null hypothesis Pick v Pick v evidence exists that the mean GPA is greater than 2.75.
Step by Step Solution
There are 3 Steps involved in it
1 Expert Approved Answer
Step: 1 Unlock

Question Has Been Solved by an Expert!
Get step-by-step solutions from verified subject matter experts
Step: 2 Unlock
Step: 3 Unlock