

Question: Use SolverTable to run a sensitivity analysis on the cost per assembling labor hour, letting it vary from $ 5 to $ 2 0 in
Use SolverTable to run a sensitivity analysis on the
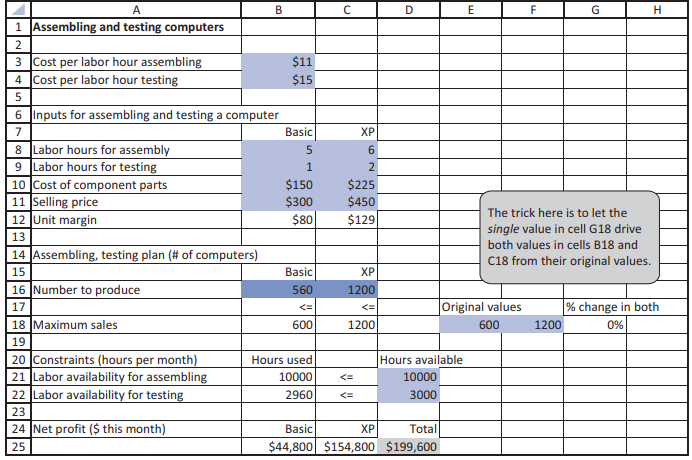
cost per assembling labor hour, letting it vary from $
to $ in increments of $ Keep track of the computers produced in row the hours used in the range
B:B and the total profit. Discuss your findings.
Are they intuitively what you expected?tableABCDEFGHAssembling and testing computers,,,,,,,Cost per labor hour assembling,$Cost per labor hour testing,$Inputs for assembling and testing a cointer,,,,,,Basic,XPLabor hours for assembly,Labor hours for testing,Cost of component parts,$$Selling price,$$
tableThe trick here is to let thesingle value in cell G driveboth values in cells B andC from their original values.Unit margin,$$Assembling, testing plan # of computersBasic,XPNumber to produce,Original values, change in bothMaximum sales,Constraints hours per monthHours used,,Hours available,,,Labor availability for assembling,Labor availability for testing,Net profit $ this monthBasic,XPTotal,,,,$$ $
Step by Step Solution
There are 3 Steps involved in it
1 Expert Approved Answer
Step: 1 Unlock

Question Has Been Solved by an Expert!
Get step-by-step solutions from verified subject matter experts
Step: 2 Unlock
Step: 3 Unlock