

Question: Use Summary 5b, Table 2, Column 2 1.Select a different quantitative variable. 2.Divide the sample members into 2 groups based on marital status of the
Use Summary 5b, Table 2, Column 2
1.Select a different quantitative variable.
2.Divide the sample members into 2 groups based on marital status of the head of household.
3.Find xbar1, s1, n1 using Excel
4.Find xbar2, s2, n2 using Excel
5.Find s =
Determine whether there is a difference in the mean of the quantitative variable between married and not-married households using the 2 independent samples hypothesis test. Include a screen shot of any applet you used in your calculations.
6.Choose a significance level ?.
7.What is the null hypothesis Ho?
8.What is the alternative hypothesis Ha?
9.What is the test statistic t?
10.What is the corresponding p value derived from the t statistic? (Show a scree shot of how you derived the p value.)
11.What is your conclusion on the null and alternative hypothesis?
12.Explain your results in everyday language.
this is table 5B and the variables
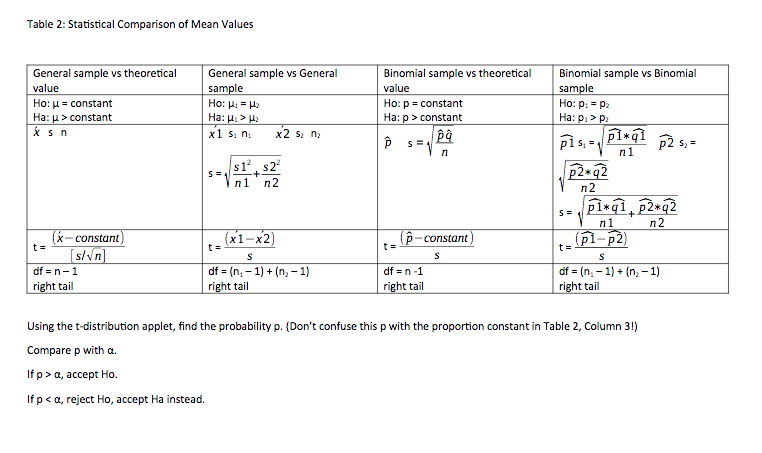
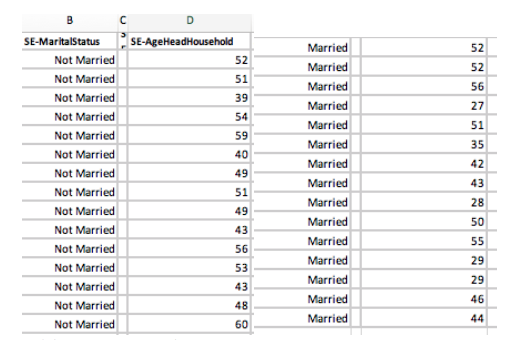
Table 2: Statistical Comparison of Mean Values General sample vs theoretical General sample vs General Binomial sample vs theoretical Binomial sample vs Binomial value sample value sample Ho: = constant Ho: Hi = 12 Ho: p = constant Ho: P1 = P2 Ha: ( > constant Ha: H: > Wa Ha: p > constant Ha: p1 > P ksn x1 s, n x2 S. n2 D pis = pi* q1 n p2 52 = s1 , $2- n1 n2 p2* 42 n 2 pi*q1 p2*42 n 2 x - constant t= t = (x1-x2) t= p - constant t= (p1- p2) s/vn] S S S df = n - 1 df = (n, - 1) + (n, - 1) df = n -1 df = (n, - 1) + (n, -1) right tail right tail right tail right tail Using the t-distribution applet, find the probability p. (Don't confuse this p with the proportion constant in Table 2, Column 3!) Compare p with a. If p > a, accept Ho. If p
Step by Step Solution
There are 3 Steps involved in it

Get step-by-step solutions from verified subject matter experts