

Question: . Use technology (such as Desmos), for this problem as well. The table shows the daily crude oil imports into the United States, measured
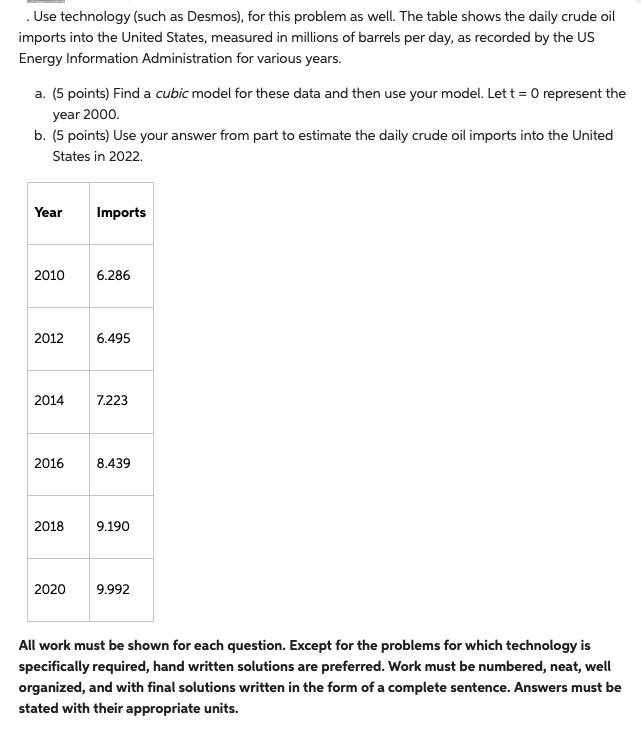
. Use technology (such as Desmos), for this problem as well. The table shows the daily crude oil imports into the United States, measured in millions of barrels per day, as recorded by the US Energy Information Administration for various years. a. (5 points) Find a cubic model for these data and then use your model. Let t = 0 represent the year 2000. b. (5 points) Use your answer from part to estimate the daily crude oil imports into the United States in 2022. Year 2010 2012 2014 2016 2018 2020 Imports 6.286 6.495 7.223 8.439 9.190 9.992 All work must be shown for each question. Except for the problems for which technology is specifically required, hand written solutions are preferred. Work must be numbered, neat, well organized, and with final solutions written in the form of a complete sentence. Answers must be stated with their appropriate units.
Step by Step Solution
3.64 Rating (158 Votes )
There are 3 Steps involved in it
The table shows the daily crude oil import into the United ... View full answer

Get step-by-step solutions from verified subject matter experts