

Question: Use technology to find the indicated area under the standard Normal curve. Include an appropriately labeled sketch of the Normal curve and shade the appropriate
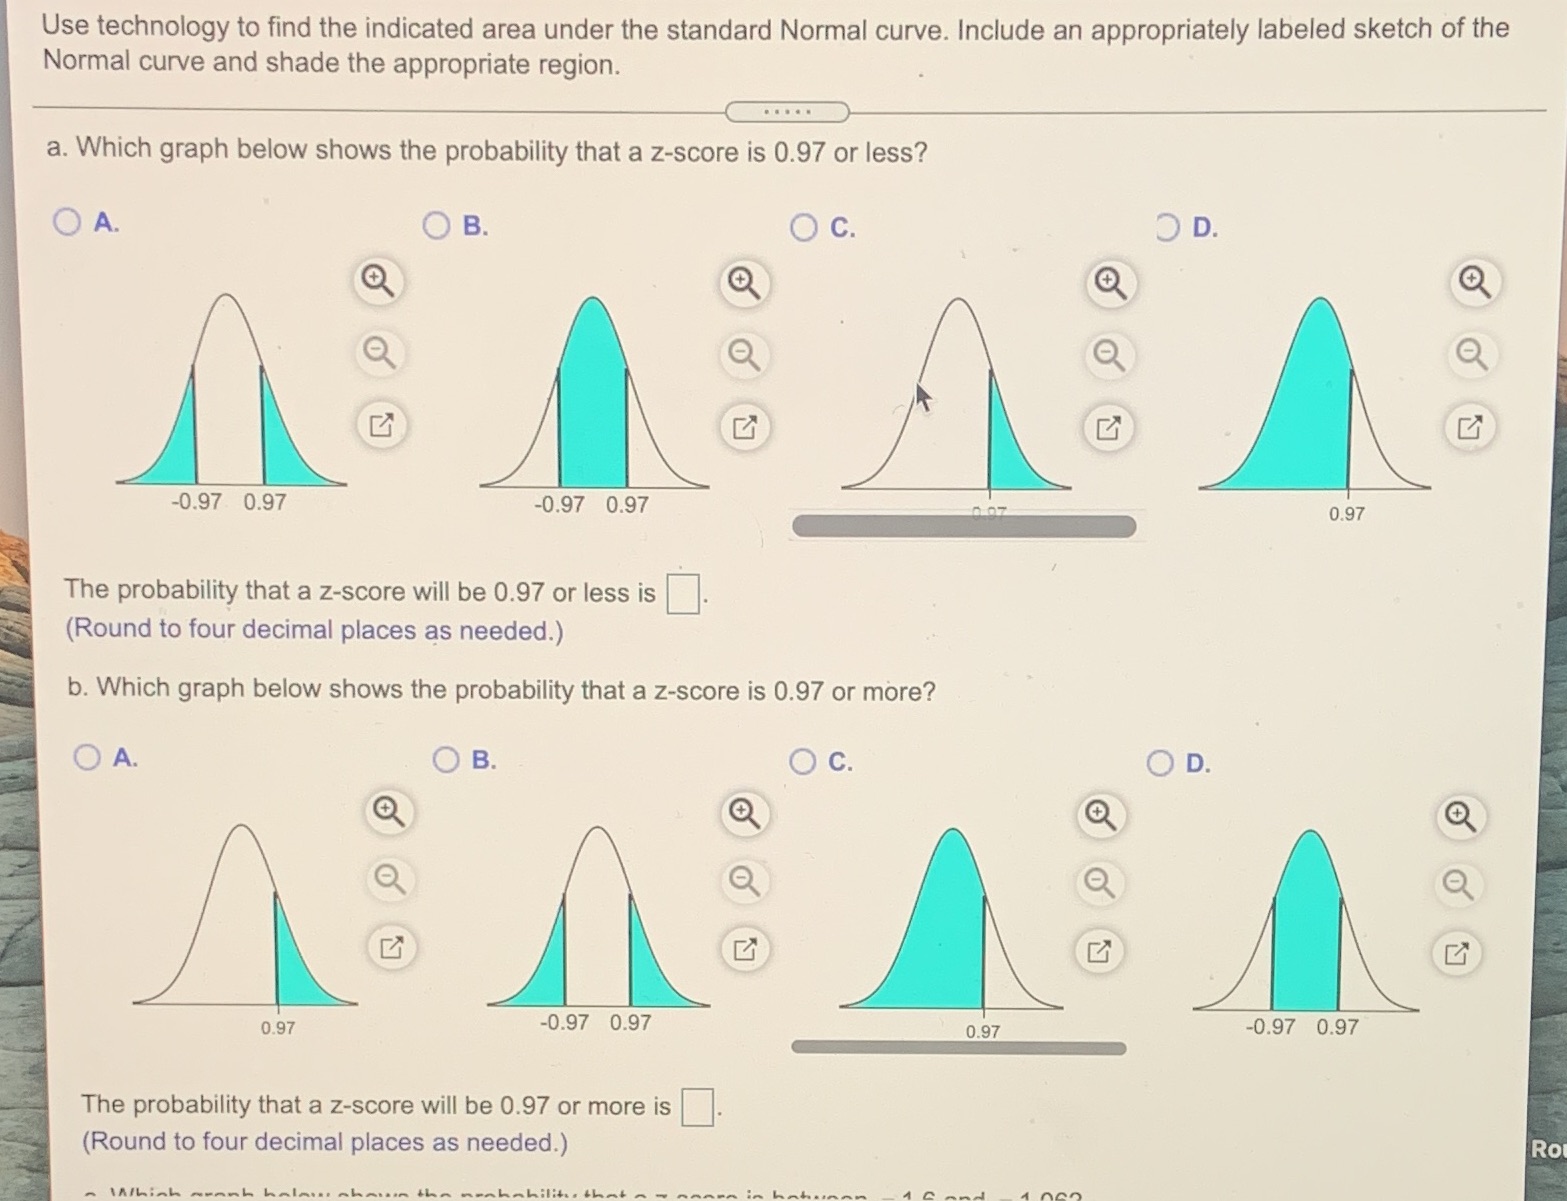
Use technology to find the indicated area under the standard Normal curve. Include an appropriately labeled sketch of the Normal curve and shade the appropriate region. . . . .. a. Which graph below shows the probability that a z-score is 0.97 or less? O A. O B. O C. OD. -0.97 0.97 -0.97 0.97 0.97 The probability that a z-score will be 0.97 or less is (Round to four decimal places as needed.) b. Which graph below shows the probability that a z-score is 0.97 or more? O A. O B. O c. O D. Q 0.97 -0.97 0.97 0.97 -0.97 0.97 The probability that a z-score will be 0.97 or more is (Round to four decimal places as needed.) Ro
Step by Step Solution
There are 3 Steps involved in it
1 Expert Approved Answer
Step: 1 Unlock

Question Has Been Solved by an Expert!
Get step-by-step solutions from verified subject matter experts
Step: 2 Unlock
Step: 3 Unlock