

Use Technology To Find The Mean, Median, Standard Deviation, And Variance Of The Sample Data Organized In
Question:
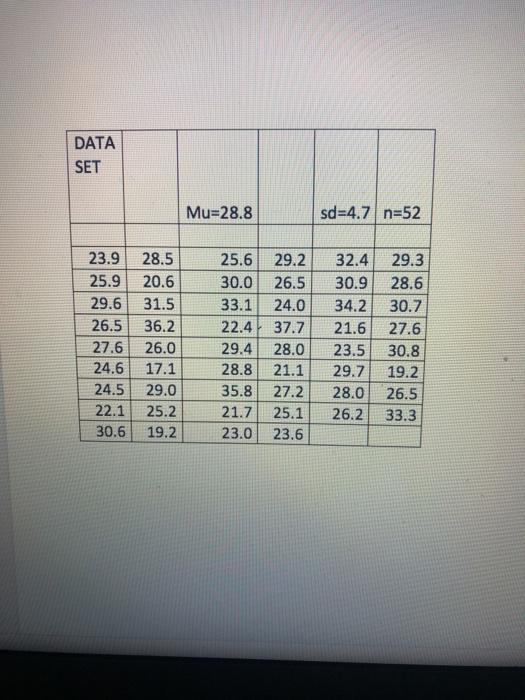
Use Technology To Find The Mean, Median, Standard Deviation, And Variance Of The Sample Data Organized In Table 3 (From Step 5 Above). Put These Values Into A Table With The Proper Symbol In The Left Column And The Value Of The Statistic In The Right Column. Also, From The Original Data Set, Put The Values Of The Range And Sample Size In The Table.
Use technology to find the mean, median, standard deviation, and variance of the sample data organized in Table 3 (from step 5 above). Put these values into a table with the proper symbol in the left column and the value of the statistic in the right column. Also, from the original data set, put the values of the range and sample size in the table. The median and range do not generally have symbols so the terms “Median” and “Range” can be used in the left STA2023 Application (2017) Saylor 2 column. Identify the modal class (the one with the highest frequency). Put the terms “Modal Class” in the left column and the class interval in the right column. The statistics should be rounded properly (one more decimal place than the data). Label this “Table 4: Summary Statistics”

Expert Answer:


