

Question: Use the accompanying data table to (a) draw a normal probability plot, (b) determine the linear correlation between the observed values and the expected z-scores,
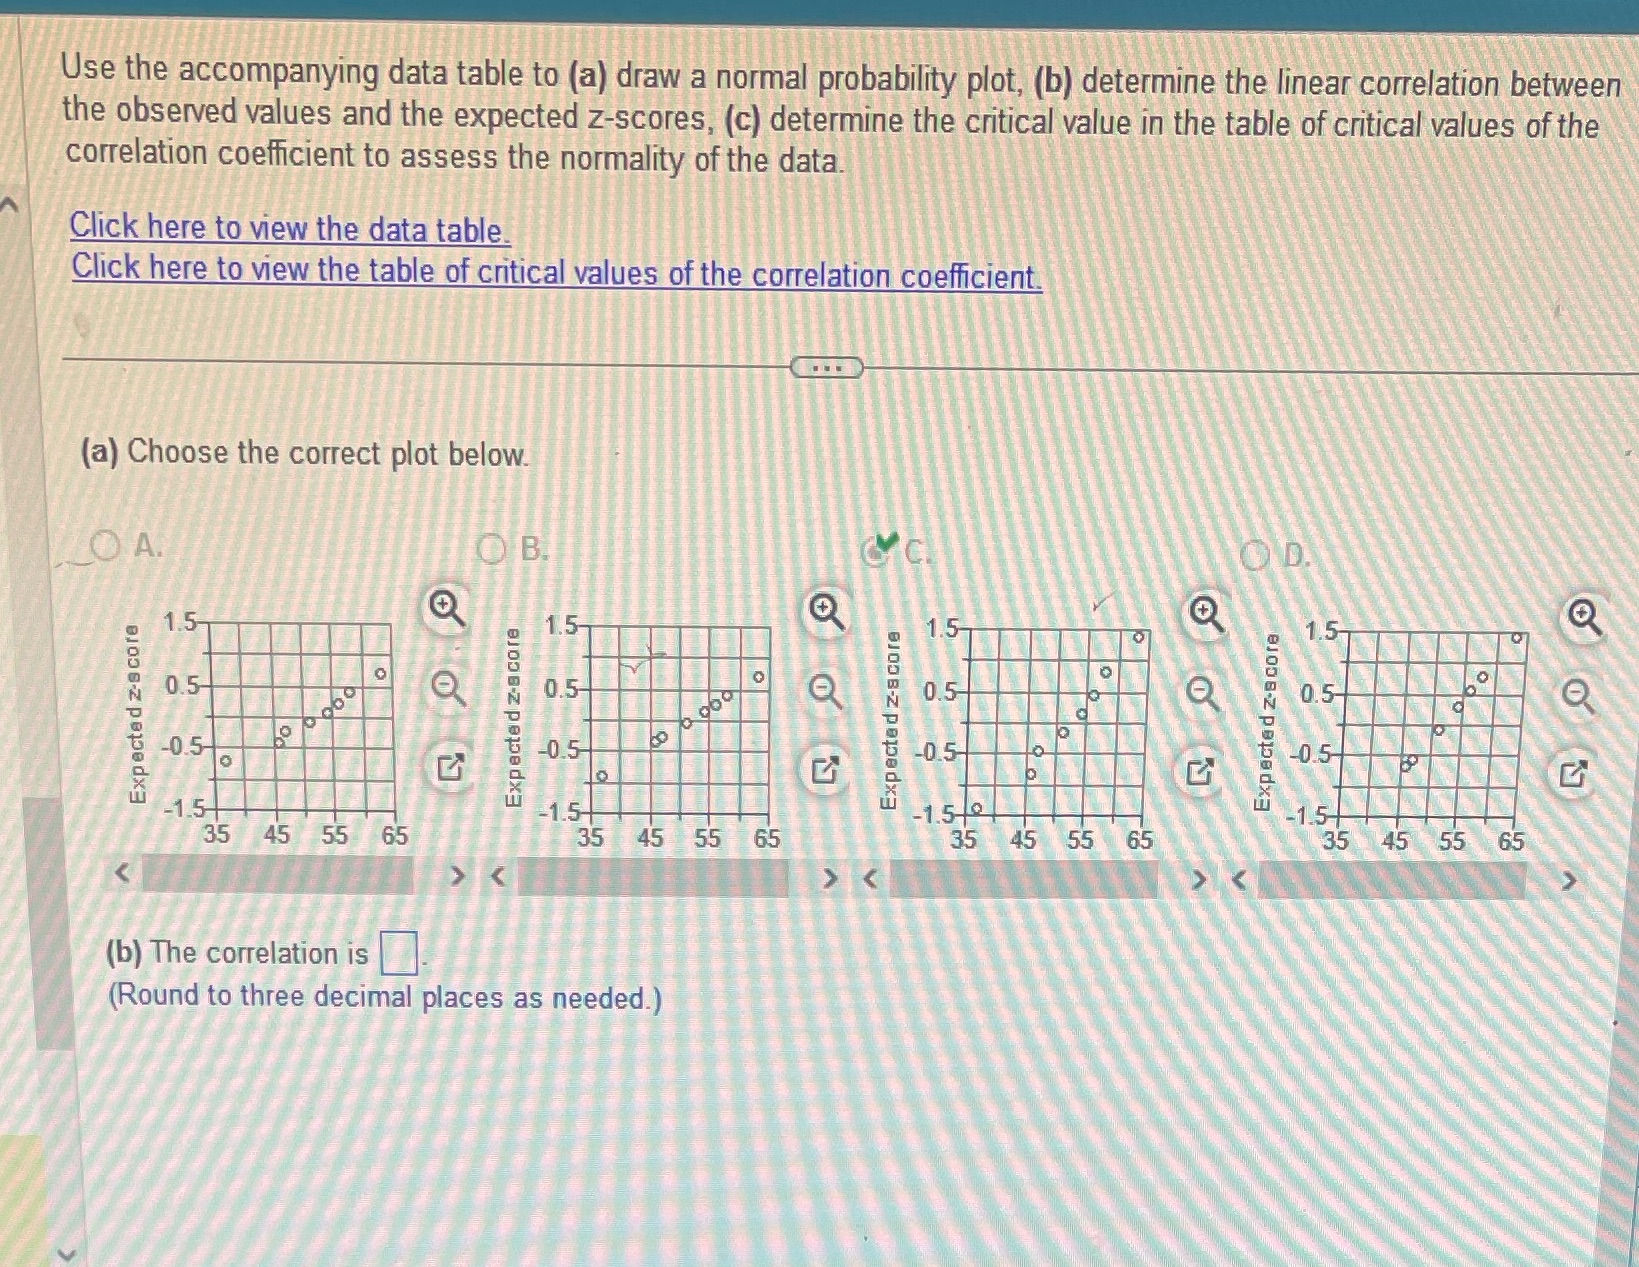
Use the accompanying data table to (a) draw a normal probability plot, (b) determine the linear correlation between the observed values and the expected z-scores, (c) determine the critical value in the table of critical values of the correlation coefficient to assess the normality of the data. Click here to view the data table. Click here to view the table of critical values of the correlation coefficient. (a) Choose the correct plot below. OA. O B 1.5 1.5 1.5 0.5- 0.5 0. Expected z-score Expected z-score Expected z-score Expected z-score -0.5- -0.5- -1.5 -1.5 35 45 55 65 35 65 45 55 65 35 45 55 65 (b) The correlation is (Round to three decimal places as needed.)
Step by Step Solution
There are 3 Steps involved in it

Get step-by-step solutions from verified subject matter experts