

Question: Use the attached spreadsheet to analyze the data and answer the questions for this case. The questions are on the spreadsheet and the answers need
Use the attached spreadsheet to analyze the data and answer the questions for this case. The questions are on the spreadsheet and the answers need to be typed onto an excel spreadsheet. For calculations, show the formulas in the spreadsheet, not just a number. 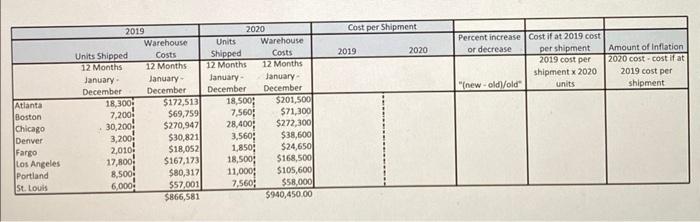
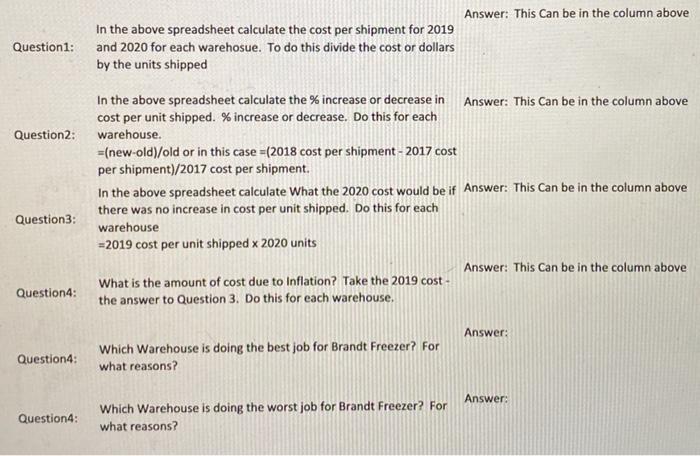
Answer: This Can be in the column above In the above spreadsheet calculate the cost per shipment for 2019 and 2020 for each warehosue. To do this divide the cost or dollars by the units shipped In the above spreadsheet calculate the \% increase or decrease in Answer: This Can be in the column above cost per unit shipped. % increase or decrease. Do this for each warehouse. =(new-old)/old or in this case =(2018 cost per shipment 2017 cost per shipment)/2017 cost per shipment. In the above spreadsheet calculate What the 2020 cost would be if Answer: This Can be in the column above there was no increase in cost per unit shipped. Do this for each warehouse =2019 cost per unit shipped 2020 units Answer: This Can be in the column above What is the amount of cost due to Inflation? Take the 2019 costestion4: the answer to Question 3. Do this for each warehouse. Answer: Which Warehouse is doing the best job for Brandt Freezer? For what reasons? Which Warehouse is doing the worst job for Brandt Freezer? For Answer: what reasons
Step by Step Solution
There are 3 Steps involved in it
1 Expert Approved Answer
Step: 1 Unlock

Question Has Been Solved by an Expert!
Get step-by-step solutions from verified subject matter experts
Step: 2 Unlock
Step: 3 Unlock