

Question: Use the attached Word doc and answer ALL questions. I submitted this yesterday morning but the tutor did not complete even AFTER extending the deadline.
Use the attached Word doc and answer ALL questions. I submitted this yesterday morning but the tutor did not complete even AFTER extending the deadline. I need this turned quick, withing four hours. I am paying a fair price so do good, but quick work please. Remember you MUST use the attached Word doc and answer ALL questions.
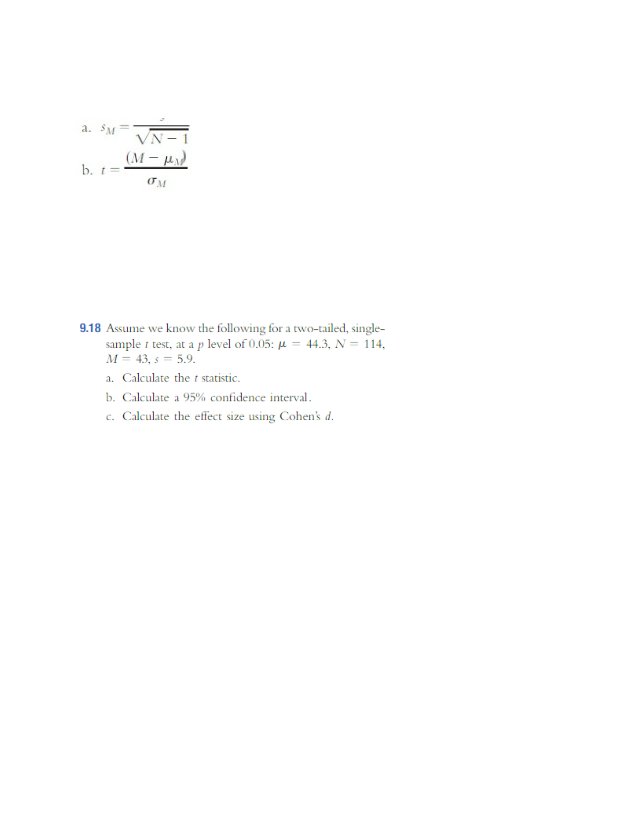
9.12 We use formulas to describe calculations. Find the error in each of the following formulas. Explain why each is incorrect and provide a correction.
9.16 Calculate degrees of freedom and identify the critical t value for a single-sample t test in each of the following circumstances:
a. Two-tailed test, N = 8, p level of 0.10
b. One-tailed test, N = 42, p level of 0.05
c. Two-tailed test, N = 89, p level of 0.01
9.26 Paid days off and the single-sample t test: The number of paid days off (e.g., vacation, sick leave) taken by eight employees at a small local business is compared to the national average. You are hired as a consultant by the new business owner to help her determine how many paid days off she should provide. In general, she wants to set some standard for her employees and for herself. Lets assume your search on the Internet for data on paid days off leaves you with the impression that the national average is 15 days. The data for the eight local employees during the last scal year are: 10, 11, 8, 14, 13, 12, 12, and 27 days.
a. Write hypotheses for your research.
b. Which type of test would be appropriate to analyze these data in order to answer your question?
c. Before doing any computations, do you have any concerns about this research? Are there any questions you might like to ask about the data you have been given?
d. Calculate the appropriate t statistic. Show all of your work in detail.
e. Draw a statistical conclusion for this business owner.
11.20 Below are several sample means. For each class, calculate the differences between the means for students who sit in the front versus the back of a classroom.
11.26 Making a decision: Numeric results for several independent-samples t tests are presented here. Decide whether each test is statistically signicant, and report each result in the standard APA format.
a. A total of 73 people were studied, 40 in one group and 33 in the other group. The test statistic was calculated as 2.13 for a two-tailed test with a p level of 0.05.
b. One group of 23 people was compared to another group of 18 people. The t statistic obtained for their data was 1.77. Assume you were performing a two-tailed test with a p level of 0.05.
c. One group of nine mice was compared to another group of six mice, using a two-tailed test at a p level of 0.01. The test statistic was calculated as 3.02.
9.12 We use formulas to describe calculations. Find the error in each of the following formulas. Explain why each is incorrect and provide a correction. 9.16 Calculate degrees of freedom and identify the critical t value for a single-sample t test in each of the following circumstances: a. Two-tailed test, N = 8, p level of 0.10 b. One-tailed test, N = 42, p level of 0.05 c. Two-tailed test, N = 89, p level of 0.01 9.26 Paid days off and the single-sample t test: The number of paid days off (e.g., vacation, sick leave) taken by eight employees at a small local business is compared to the national average. You are hired as a consultant by the new business owner to help her determine how many paid days off she should provide. In general, she wants to set some standard for her employees and for herself. Let's assume your search on the Internet for data on paid days off leaves you with the impression that the national average is 15 days. The data for the eight local employees during the last scal year are: 10, 11, 8, 14, 13, 12, 12, and 27 days. a. Write hypotheses for your research. b. Which type of test would be appropriate to analyze these data in order to answer your question? c. Before doing any computations, do you have any concerns about this research? Are there any questions you might like to ask about the data you have been given? d. Calculate the appropriate t statistic. Show all of your work in detail. e. Draw a statistical conclusion for this business owner. 11.20 Below are several sample means. For each class, calculate the differences between the means for students who sit in the front versus the back of a classroom. 11.26 Making a decision: Numeric results for several independent-samples t tests are presented here. Decide whether each test is statistically signicant, and report each result in the standard APA format. a. A total of 73 people were studied, 40 in one group and 33 in the other group. The test statistic was calculated as 2.13 for a two-tailed test with a p level of 0.05. b. One group of 23 people was compared to another group of 18 people. The t statistic obtained for their data was 1.77. Assume you were performing a two-tailed test with a p level of 0.05. c. One group of nine mice was compared to another group of six mice, using a two-tailed test at a p level of 0.01. The test statistic was calculated as 3.02
Step by Step Solution
There are 3 Steps involved in it

Get step-by-step solutions from verified subject matter experts