

Question: Use the average experimental acceleration from each table (Tables 1-3) to plot vs. sin where refers to the inclination of the track graph table 1-3
Use the average experimental acceleration from each table (Tables 1-3) to plot vs. sin where refers to the inclination of the track
graph table 1-3 just like the sample 3 graphs please
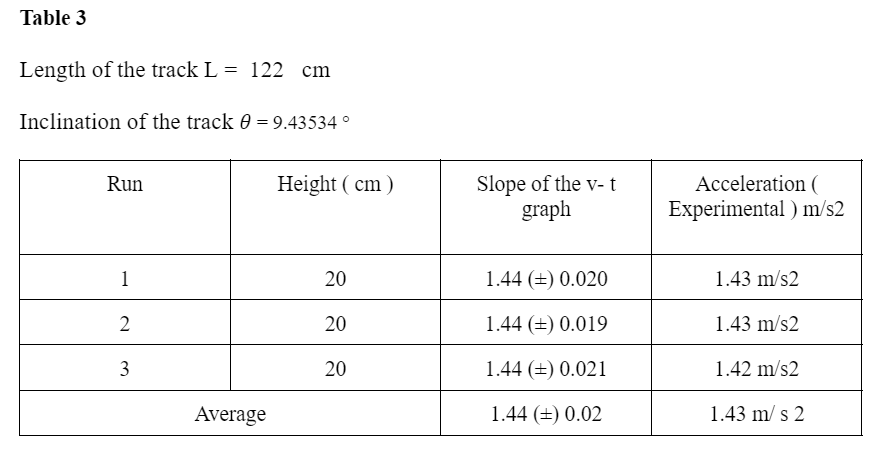
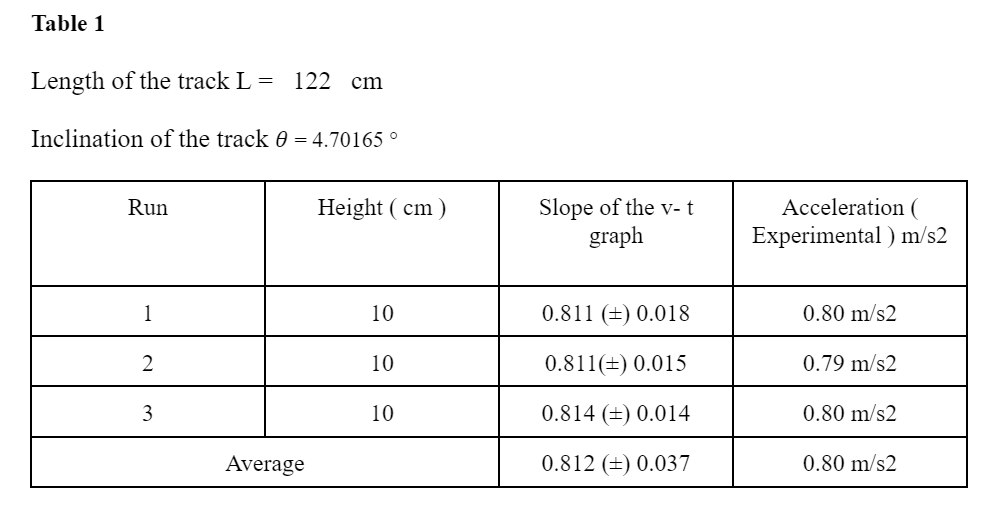
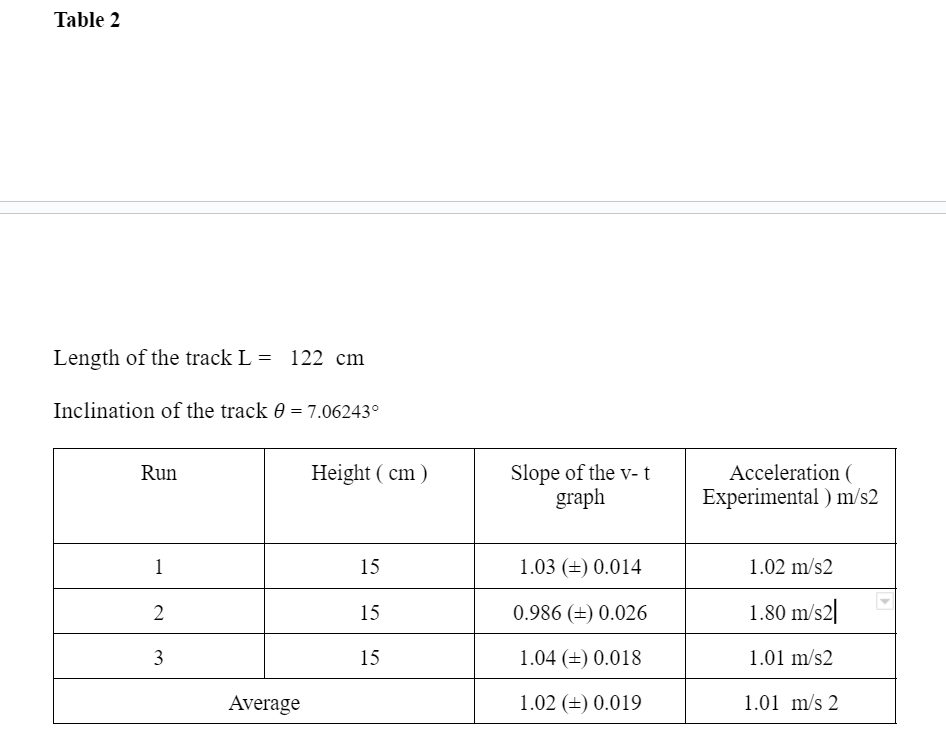
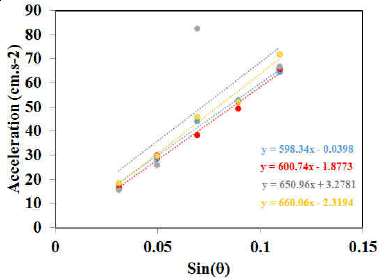
Table 3 Length of the track L = 122 cm Inclination of the track 0 =9.43534 0 Run Height ( cm ) Slope of the v- t Acceleration ( graph Experimental ) m/s2 20 1.44 (+) 0.020 1.43 m/s2 2 20 1.44 (#) 0.019 1.43 m/s2 20 1.44 (#) 0.021 1.42 m/s2 Average 1.44 (+) 0.02 1.43 m/ s 2Table 1 Length of the track L = 122 e111 Inclination of the track 6 = 4.70165 '9 Height { cm ) Slope of the v- t Acceleration { graph Experimental ) one: 0.811 (212)0018 080111.552 0.811(2I2) 0.015 079111-552 0.81%L [2) 0.014 080111-32 Average 0.812 [:1 0.037 0.80 111.582 Table 2 Length of the track L = 122 cm Inclination 0f the track 9 = 1062433 Run Height ( cm ) Slope 0f the \\-'- t Acceleration ( graph Experimental 1111552 1 15 1.03 {2} 0.014 1.02 111:"32 2 15 0.986 (:1 0.026 1.80 m.-"32| 3 15 1.04 {:y 0.018 1.01 111.532 Average 1.02 {:1 0.019 1.01 11153 2
Step by Step Solution
There are 3 Steps involved in it

Get step-by-step solutions from verified subject matter experts