

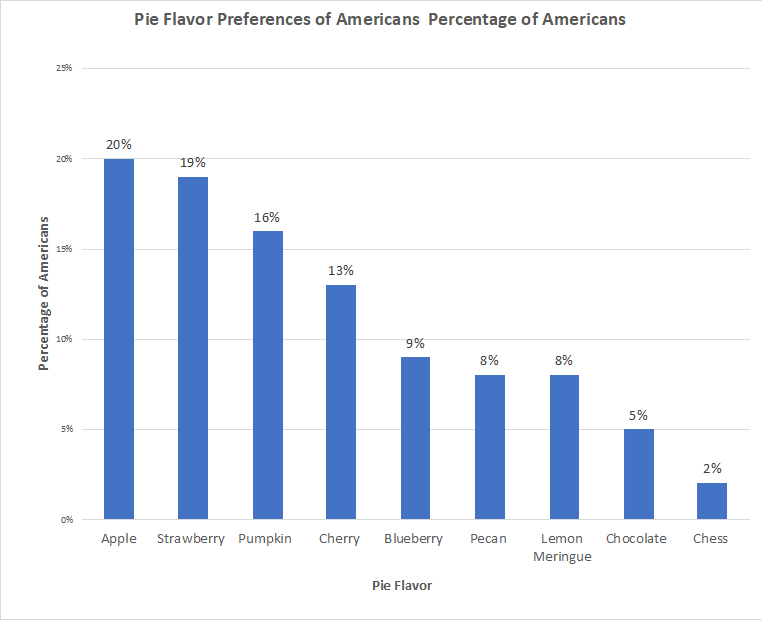
Question: Use the bar chart below to summarize the data in the form of frequency and relative frequency. Assume that the data was collected from a
Use the bar chart below to summarize the data in the form of frequency and relative frequency. Assume that the data was collected from a survey of 2500 people.
Hint: You can calculate the frequency by multiplying the total number of people in the study by the relative frequency (in decimal form). All answers in the table are in whole numbers.
Step by Step Solution
There are 3 Steps involved in it
1 Expert Approved Answer
Step: 1 Unlock

Question Has Been Solved by an Expert!
Get step-by-step solutions from verified subject matter experts
Step: 2 Unlock
Step: 3 Unlock