

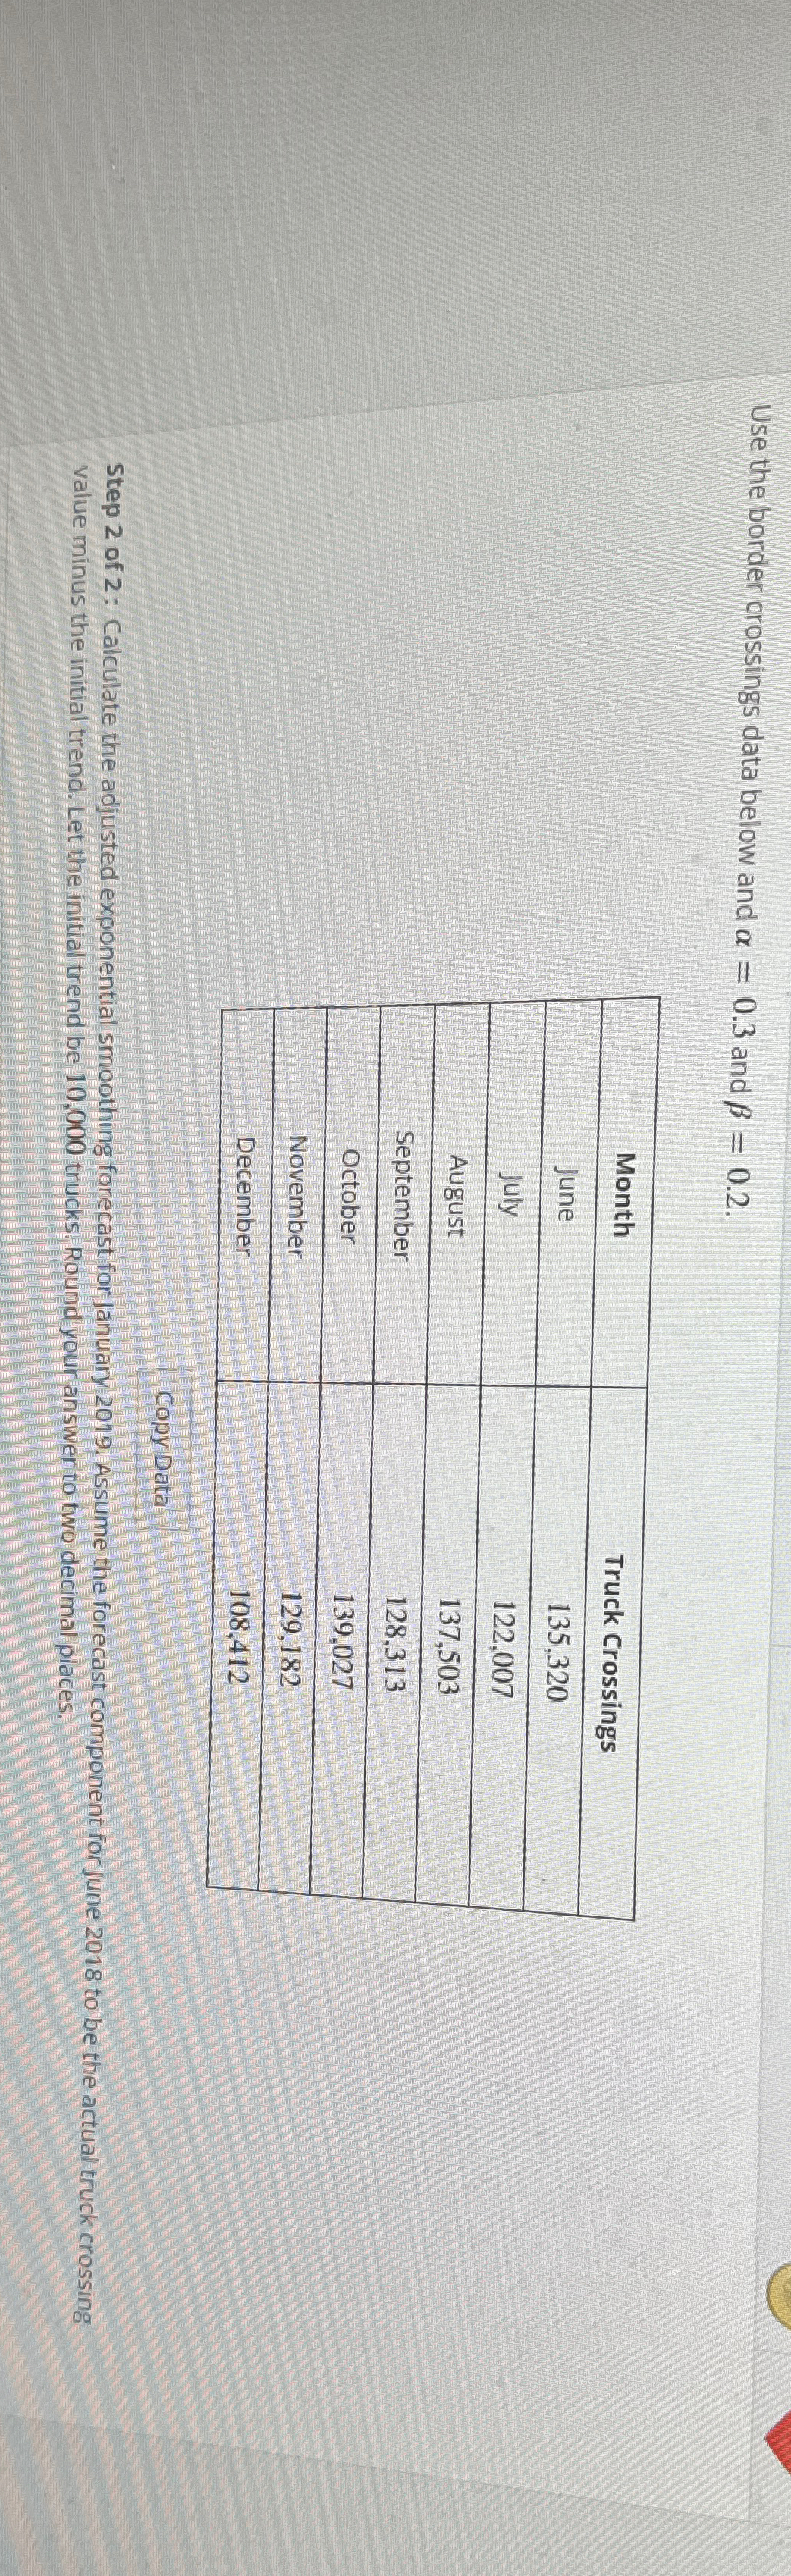
Question: Use the border crossings data below and = 0 . 3 and = 0 . 2 . table [ [ Month , Truck Crossings
Use the border crossings data below and and
tableMonthTruck CrossingsJuneJulyAugustSeptemberOctoberNovemberDecember
Copy Data
Step of : Calculate the adjusted exponential smoothing forecast for January Assume the forecast component for June to be the actual truck crossing value minus the initial trend. Let the initial trend be trucks. Round your answer to two decimal places.
Step by Step Solution
There are 3 Steps involved in it
1 Expert Approved Answer
Step: 1 Unlock

Question Has Been Solved by an Expert!
Get step-by-step solutions from verified subject matter experts
Step: 2 Unlock
Step: 3 Unlock