

Question: Use the calculator to graph the function y = sin x- follow the directions given below - NEATNESS REQUIRED Set the MODE to degrees
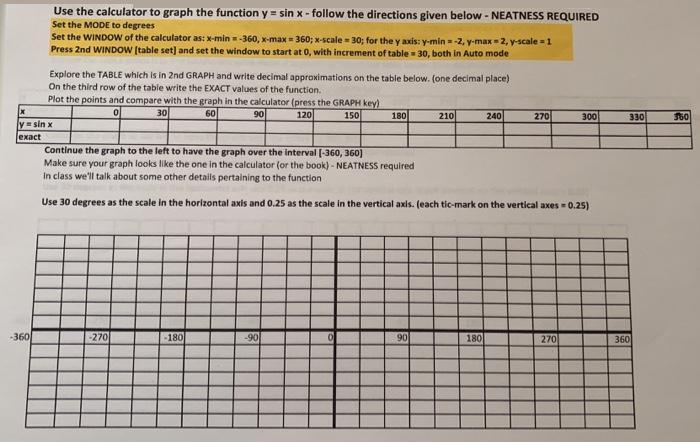
Use the calculator to graph the function y = sin x- follow the directions given below - NEATNESS REQUIRED Set the MODE to degrees Set the WINDOW of the calculator as: x-min =-360, x-max = 360; x-scale = 30; for the y axis: y-min = -2, y-max= 2, y-scale =1 Press 2nd WINDOW (table set] and set the window to start at 0, with increment of table 30, both in Auto mode Explore the TABLE which is in 2nd GRAPH and write decimal approximations on the table below. (one decimal place) On the third row of the table write the EXACT values of the function. Plot the points and compare with the graph in the calculator (press the GRAPH key) 30 60 90 150 180 120 210 240 270 300 330 y sin x |ct Continue the graph to the left to have the graph over the interval (-360, 360) Make sure your graph looks like the one in the calculator (or the book) - NEATNESS required In class we'll talk about some other details pertaining to the function Use 30 degrees as the scale in the horizontal axis and 0.25 as the scale in the vertical axis. (each tic-mark on the vertical axes 0.25) -360 -270 -180 -90 90 180 270 360
Step by Step Solution
3.44 Rating (154 Votes )
There are 3 Steps involved in it

Get step-by-step solutions from verified subject matter experts