

Question: Use the chart to identify the risk level for each activity. Heat Index Temperature (F) With Prolonged Exposure and/or Physical Activity 80 82 84 86
Use the chart to identify the risk level for each activity.
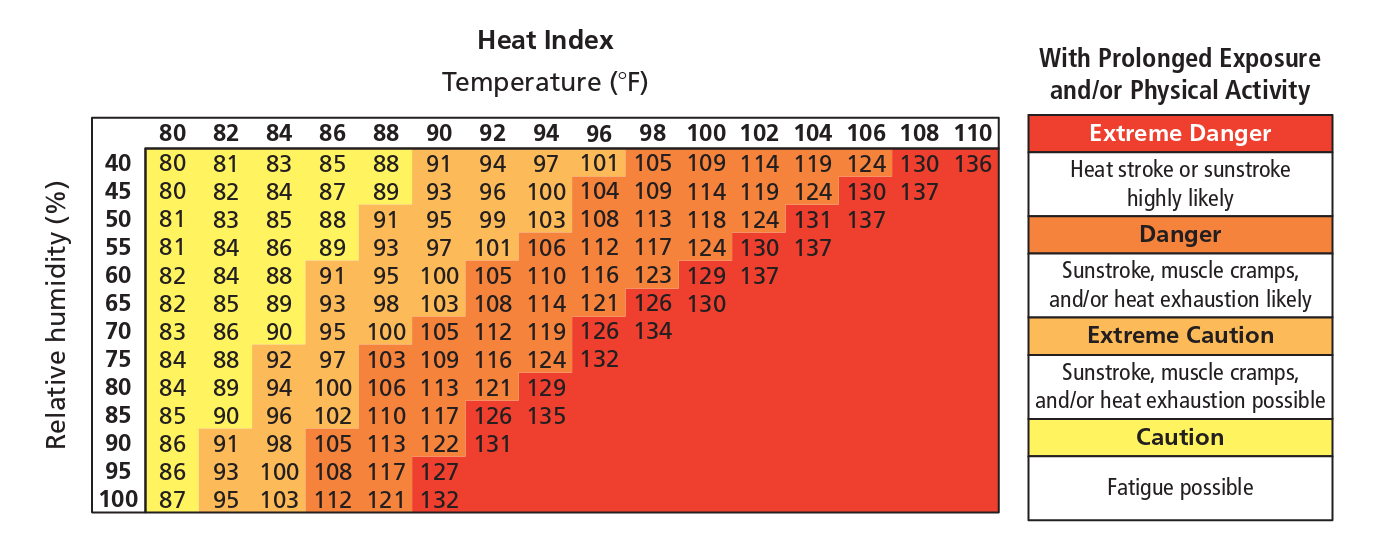
Heat Index Temperature (F) With Prolonged Exposure and/or Physical Activity 80 82 84 86 88 90 92 94 96 98 100 102 104 106 108 110 Extreme Danger 40 80 81 83 85 88 91 94 97 101 105 109 114 119 124 130 136 Relative humidity (%) Heat stroke or sunstroke 45 80 82 84 87 89 93 96 100 104 109 114 119 124 130 137 50 81 83 85 88 91 95 99 103 108 113 118 124 131 137 highly likely 55 81 84 86 89 93 97 101 106 112 117 124 130 137 Danger 60 82 84 88 91 95 100 105 110 116 123 129 137 Sunstroke, muscle cramps, 65 82 85 89 93 98 103 108 114 121 126 130 and/or heat exhaustion likely 70 83 86 90 95 100 105 112 119 126 134 Extreme Caution 75 84 88 92 97 103 109 116 124 132 80 84 89 94 100 106 113 121 129 Sunstroke, muscle cramps, 85 85 90 96 102 110 117 126 135 and/or heat exhaustion possible 90 86 91 98 105 113 122 131 Caution 95 86 93 100 108 117 127 100 87 95 103 112 121 132 Fatigue possible
Step by Step Solution
There are 3 Steps involved in it

Get step-by-step solutions from verified subject matter experts