

Question: Use the chi square chart below to determine if your X supports or rejects your hypothesis. The degrees of freedom is determined by subtracting 1
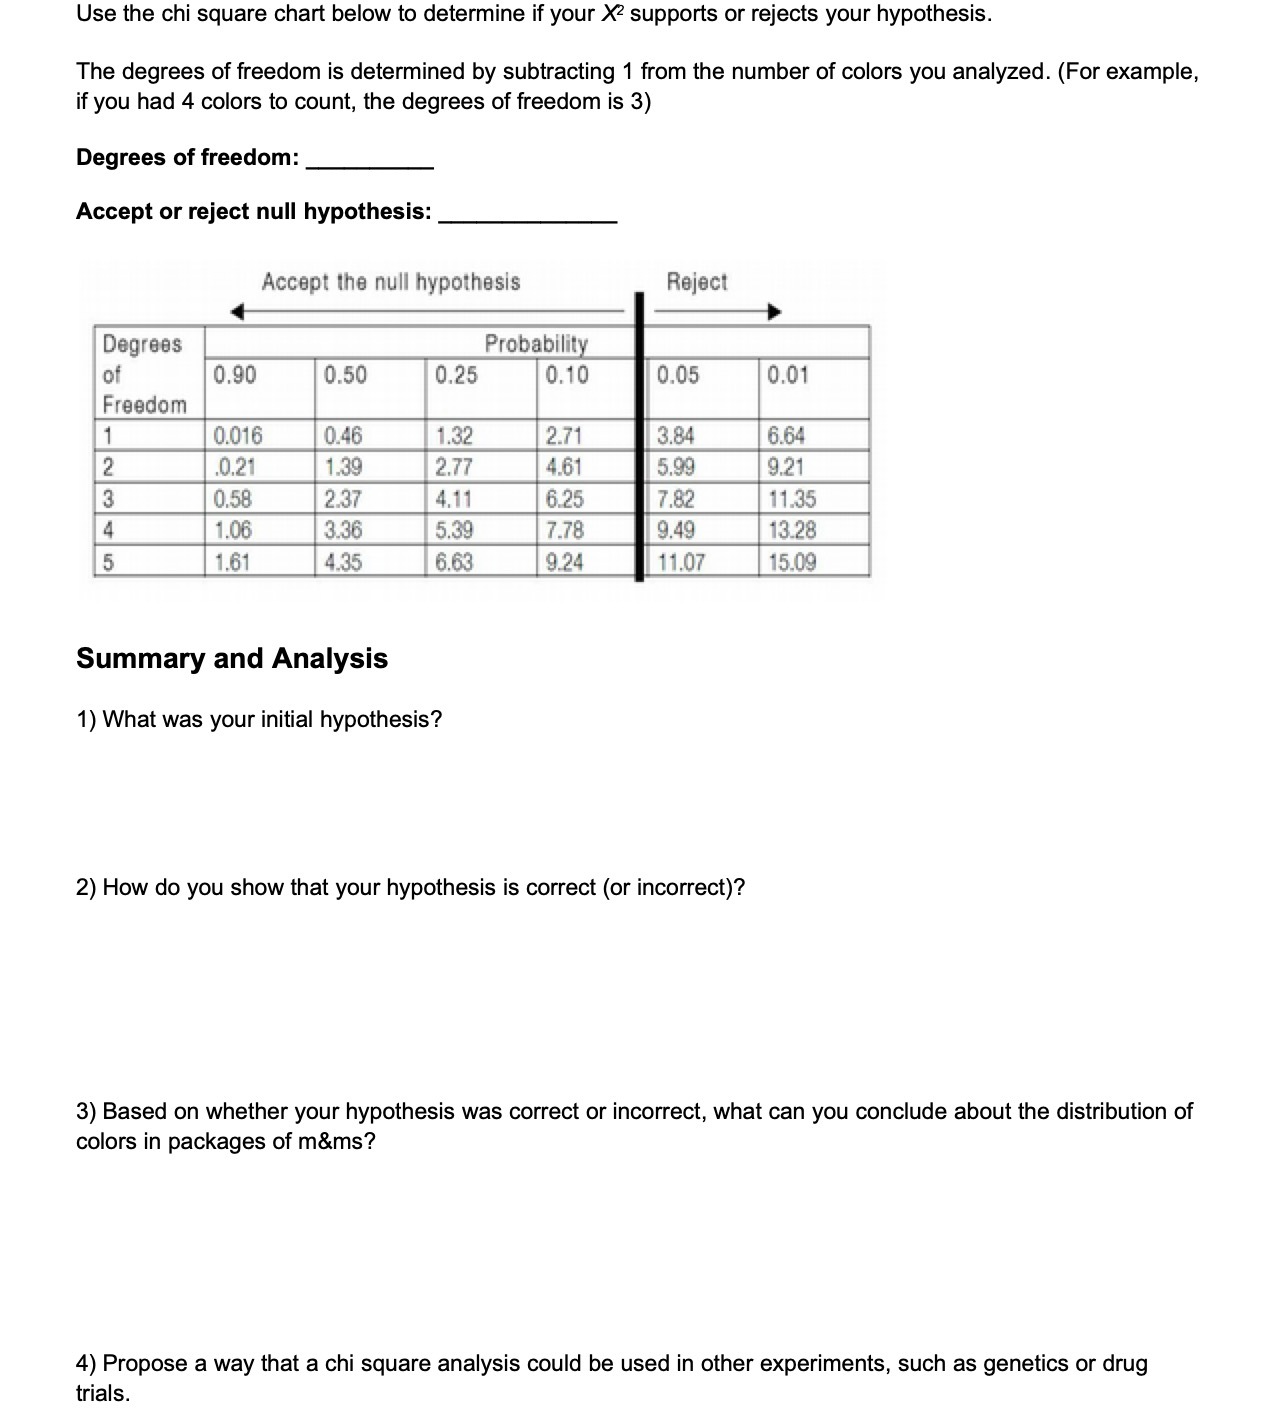

Use the chi square chart below to determine if your X supports or rejects your hypothesis. The degrees of freedom is determined by subtracting 1 from the number of colors you analyzed. (For example, if you had 4 colors to count, the degrees of freedom is 3) Degrees of freedom: Accept or reject null hypothesis: Accept the null hypothesis Reject Degrees Probability of 0.90 0.50 0.25 0.10 0.05 0.01 Freedom 1 0.016 0.46 1.32 2.71 3.84 6.64 2 .0.21 1.39 2.77 4.61 5.99 9.21 13 0.58 2.37 4.11 6.25 7.82 11.35 1.06 3.36 5.39 7.78 9.49 13.28 on 1.61 4.35 6.63 9.24 11.07 15.09 Summary and Analysis ) What was your initial hypothesis? 2) How do you show that your hypothesis is correct (or incorrect)? 3) Based on whether your hypothesis was correct or incorrect, what can you conclude about the distribution of colors in packages of m&ms? 4) Propose a way that a chi square analysis could be used in other experiments, such as genetics or drug trials
Step by Step Solution
There are 3 Steps involved in it

Get step-by-step solutions from verified subject matter experts