

Question: Use the classification of variables from the Unit 1 assignment to match each variable to one appropriate type of graph Make graphs of those variables
- Use the classification of variables from the Unit 1 assignment to match each variable to one appropriate type of graph
- Make graphs of those variables
- Give a brief written description of how the values of each variable are distributed in the sample. What does the graph tell us about the data in the heart rate sample?
Steps
- Open the Heart Rate Dataset in Excel
- Using the classification of variables from Unit 1 assignment as qualitative, quantitative discrete, or quantitative continuous, match each of the 3 variables to the most appropriate graph type. (For example, qualitative data can best be displayed with a pie chart or bar graph; continuous numerical data can best be displayed using a histogram)
- Use the graphing functions in Excel to make an appropriate graph of the data for each variable. Remember to properly label and title your graphs to clearly identify what the graph is about.
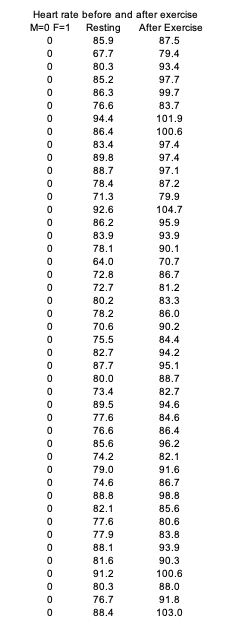
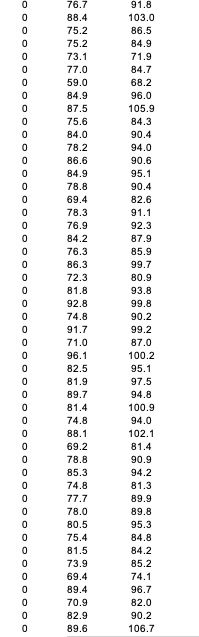
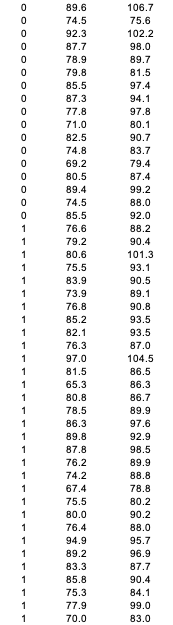
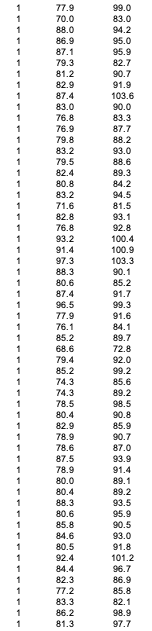
Heart rate before and after exercise M=0 F=1 Resting After Exercise 85.9 87.5 67.7 79.4 80.3 93.4 85.2 97.7 86.3 99.7 76.6 83.7 94.4 101.9 86.4 100.6 83.4 97.4 89.8 97.4 BB.7 97.1 78.4 87.2 71.3 79.9 92.6 104.7 86.2 95.9 83.9 93.9 78.1 90.1 64.0 70.7 72.8 86.7 72.7 81.2 80.2 83.3 78.2 86.0 70.6 90.2 75.5 84.4 82.7 94.2 87.7 95.1 80.0 88.7 73.4 82.7 89.5 94.6 77.6 84.6 76.6 86.4 85.6 96.2 74.2 82.1 79.0 91.6 74.6 86.7 86.B 98.8 82.1 85.6 77.6 80.6 77.9 83.B 86.1 93.9 81.6 90.3 91.2 100.6 80.3 86.0 76.7 91.8 86.4 103.076.7 91.8 103.0 75.2 86.5 75.2 84.9 73.1 71.9 77.0 84.7 59.0 68.2 84.9 96.0 87.5 105.9 75.6 84.3 84.0 90.4 78.2 94.0 86.6 90.6 84.9 95.1 78.8 90.4 69.4 82.6 78.3 91.1 76.9 92.3 B4.2 87.9 76.3 85.9 86.3 99.7 72.3 80.9 81.8 93.B 92.8 99.8 o o o o o o o o o o o o o o o o o o o o o o o o o o o o o o o o o o o o o o o o o o o o o 0 0 0 0 74.8 90.2 91.7 99.2 71.0 87.0 96.1 100.2 82.5 95.1 81.9 97.5 89.7 94.B 81.4 100.9 74.8 94.0 BB.1 102.1 69.2 81.4 78.B 90.9 85.3 94.2 74.8 81.3 77.7 89.9 78.0 89.8 80.5 95.3 75.4 84.B 81.5 B4.2 73.9 85.2 69.4 74.1 89.4 96.7 70.9 82.0 82.9 90.2 89.6 106.7\f77.9 99.0 70.0 83.0 88.0 94.2 86.9 95.0 87.1 95.9 79.3 82.7 81.2 90.7 82.9 91.9 87.4 103.6 83.0 90.0 76.8 83.3 76.9 87.7 79.8 88.2 83.2 93.0 79.5 88.6 82.4 89.3 80.8 84.2 83.2 94.5 71.6 81.5 82.8 93.1 76.8 92.8 93.2 100.4 91.4 100.9 97.3 103.3 88.3 90.1 80.6 85.2 87.4 91.7 96.5 99.3 77.9 91.6 76.1 84.1 85.2 89.7 68.6 72.8 79.4 92.0 85.2 99.2 74.3 85.6 74.3 89.2 78.5 98.5 80.4 90.8 82.9 85.9 78.9 90.7 78.6 87.0 87.5 93.9 78.9 91.4 80.0 89.1 80.4 89.2 88.3 93.5 80.6 95.9 85.8 90.5 84.6 93.0 80.5 91.8 92.4 101.2 84.4 96.7 82.3 86.9 77.2 85.8 83.3 82.1 86.2 98.9 81.3 97.786.2 98.9 81.3 97.7 90.2 96.4 78.4 85.5 84.7 101.6 89.7 94.3 78.4 88.0 79.9 88.5
Step by Step Solution
There are 3 Steps involved in it

Get step-by-step solutions from verified subject matter experts