

Question: USE THE CODE BELOW TO ANSWER THE FOLLOWING QUESTIONS IN THE PICTURE #include #include #include math.h // It contains the list of available models #include
USE THE CODE BELOW TO ANSWER THE FOLLOWING QUESTIONS IN THE PICTURE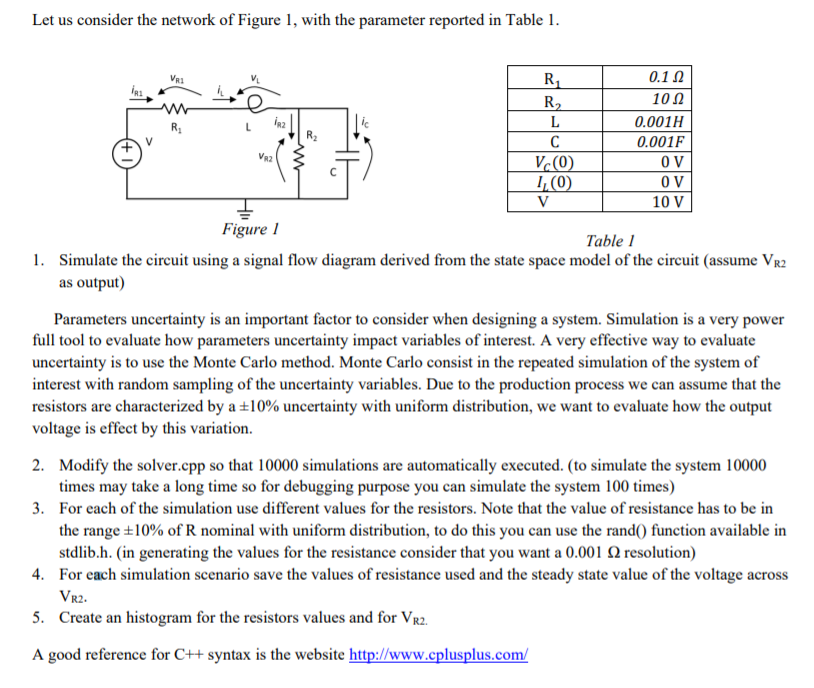
#include
#include
#include "math.h"
// It contains the list of available models
#include "mylibrary.h"
// Utility for simulation data saving
#include "SimOut.h"
#include "stdlib.h"
using namespace std;
int main()
{
// Final time
double tf = 0.1;
// Integration step
double dt = 0.00001;
// Current time
double t;
// Define Object for saving data on a file
SimOut DataLog("data2.csv");
int N = 10000;
// Open Log File
DataLog.OpenStream();
for (int i = 0; i
{
//Circuit Value Declarations
double R1 = 0.1 + ((rand() % 20 + 1)/1000.0-0.01);
double R2 = 10 + ((rand() % 2000 + 1)/1000.0-1);
double L1 = 0.001;
double C1 = 0.001;
double V1 = 10;
// Model Declarations
SourceConstant SC1(0,V1);
Gain G1(0, 1, 1/L1);
SumThree SU1(1,2,3,4,1,1,1);
FirstOrder I1(4,5,1,0,1);
Gain G11(5, 2, -R1/L1);
Gain G12(9, 3, -1/L1);
Sum SU2(6, 7, 8, 1, 1);
FirstOrder I2(8, 9, 1, 0, 1);
Gain G21(5, 6, 1/C1);
Gain G22(9, 7, -1/(R2*C1));
cout
Simulation MySim(0,tf,dt);
// Putting models in the list: Order counts !!!!
MySim.AddModelToList(&SC1);
MySim.AddModelToList(&G1);
MySim.AddModelToList(&SU1);
MySim.AddModelToList(&I1);
MySim.AddModelToList(&G11);
MySim.AddModelToList(&G12);
MySim.AddModelToList(&SU2);
MySim.AddModelToList(&I2);
MySim.AddModelToList(&G21);
MySim.AddModelToList(&G22);
// State Variable Initialization
double xiniI1[1] = {0};
I1.init(xiniI1);
double xiniI2[1] = {0};
I2.init(xiniI2);
// Initialize Simulation Variables
MySim.Init();
// Get Current Simulation Time
t = MySim.GetTime();
// Main Simulation Loop
while(MySim.Step())
{
if(t > 0.099989){
DataLog.AddDataLine(i, t, MySim.GetFlow(9), R1, R2);
}
// Get Current Simulation Time
t = MySim.GetTime();
}
}
// Close Data Log
DataLog.CloseStrem();
return 0;
}
Let us consider the network of Figure 1, with the parameter reported in Table 1 0.12 10 0.001H 0.001F 0 V 0 V 10 V Figure I Table I 1. Simulate the circuit using a signal flow diagram derived from the state space model of the circuit (assume VR2 as output) Parameters uncertainty is an important factor to consider when designing a system. Simulation is a very power full tool to evaluate how parameters uncertainty impact variables of interest. A very effective way to evaluate uncertainty is to use the Monte Carlo method. Monte Carlo consist in the repeated simulation of the system of interest with random sampling of the uncertainty variables. Due to the production process we can assume that the resistors are characterized by a 10% uncertainty with uniform distribution, we want to evaluate how the output voltage is effect by this variation. 2. Modify the solver.cpp so that 10000 simulations are automatically executed. (to simulate the system 10000 times may take a long time so for debugging purpose you can simulate the system 100 times) For each of the simulation use different values for the resistors. Note that the value of resistance has to be in the range 10% of R nominal with uniform distribution, to do this you can use the rand() function available in stdlib.h. (in generating the values for the resistance consider that you want a 0.001 2 resolution) 3. 4. For each simulation scenario save the values of resistance used and the steady state value of the voltage across 5. Create an histogram for the resistors values and for Vr2. A good reference for C++ syntax is the website http://www.cplusplus.com/ VR2 Let us consider the network of Figure 1, with the parameter reported in Table 1 0.12 10 0.001H 0.001F 0 V 0 V 10 V Figure I Table I 1. Simulate the circuit using a signal flow diagram derived from the state space model of the circuit (assume VR2 as output) Parameters uncertainty is an important factor to consider when designing a system. Simulation is a very power full tool to evaluate how parameters uncertainty impact variables of interest. A very effective way to evaluate uncertainty is to use the Monte Carlo method. Monte Carlo consist in the repeated simulation of the system of interest with random sampling of the uncertainty variables. Due to the production process we can assume that the resistors are characterized by a 10% uncertainty with uniform distribution, we want to evaluate how the output voltage is effect by this variation. 2. Modify the solver.cpp so that 10000 simulations are automatically executed. (to simulate the system 10000 times may take a long time so for debugging purpose you can simulate the system 100 times) For each of the simulation use different values for the resistors. Note that the value of resistance has to be in the range 10% of R nominal with uniform distribution, to do this you can use the rand() function available in stdlib.h. (in generating the values for the resistance consider that you want a 0.001 2 resolution) 3. 4. For each simulation scenario save the values of resistance used and the steady state value of the voltage across 5. Create an histogram for the resistors values and for Vr2. A good reference for C++ syntax is the website http://www.cplusplus.com/ VR2
Step by Step Solution
There are 3 Steps involved in it

Get step-by-step solutions from verified subject matter experts