

Question: Use the code given to write program. Thank you. Write a program that produces a bar chart showing the population growth of Rocklin, a small
 Use the code given to write program. Thank you.
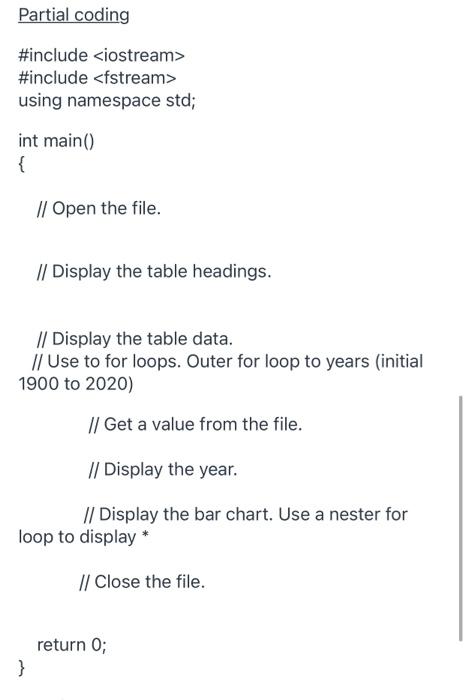
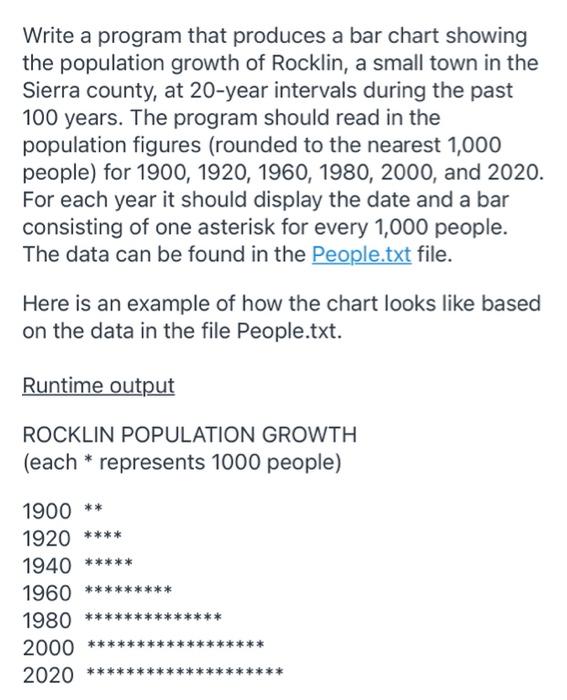
Write a program that produces a bar chart showing the population growth of Rocklin, a small town in the Sierra county, at 20-year intervals during the past 100 years. The program should read in the population figures (rounded to the nearest 1,000 people) for 1900, 1920, 1960, 1980, 2000, and 2020. For each year it should display the date and a bar consisting of one asterisk for every 1,000 people. The data can be found in the People.txt file. Here is an example of how the chart looks like based on the data in the file People.txt. Runtime output ROCKLIN POPULATION GROWTH (each * represents 1000 people) 1900 ** 1920 **** 1940 *** 1960 1980 2000 2020 Partial coding #include
Step by Step Solution
There are 3 Steps involved in it

Get step-by-step solutions from verified subject matter experts