

Question: Use the collected data in Cable I to find a best-fit line and its function in two different ways; Use Excel to make data plot
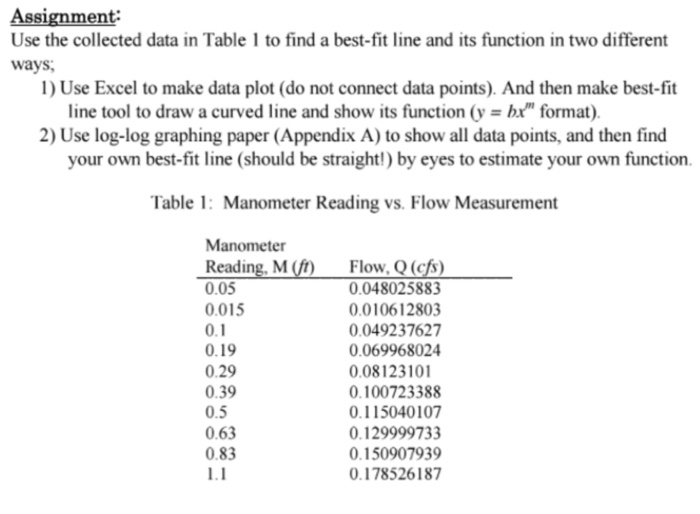
Use the collected data in Cable I to find a best-fit line and its function in two different ways; Use Excel to make data plot (do not connect data points) And then make best-fit line tool to draw a curved line and show its function (y = bx^m format) Use log-log graphing paper (Appendix A) to show all data points, and then find your own best-fit line (should be straight1) by eyes to estimate your own function Table 1: Manometer Reading vs How Measurement
Step by Step Solution
There are 3 Steps involved in it
1 Expert Approved Answer
Step: 1 Unlock

Question Has Been Solved by an Expert!
Get step-by-step solutions from verified subject matter experts
Step: 2 Unlock
Step: 3 Unlock