

Question: Use the coordinates given in the figure to create vectors x and Y that describe the top and the bottom borderlines of the wall. Y
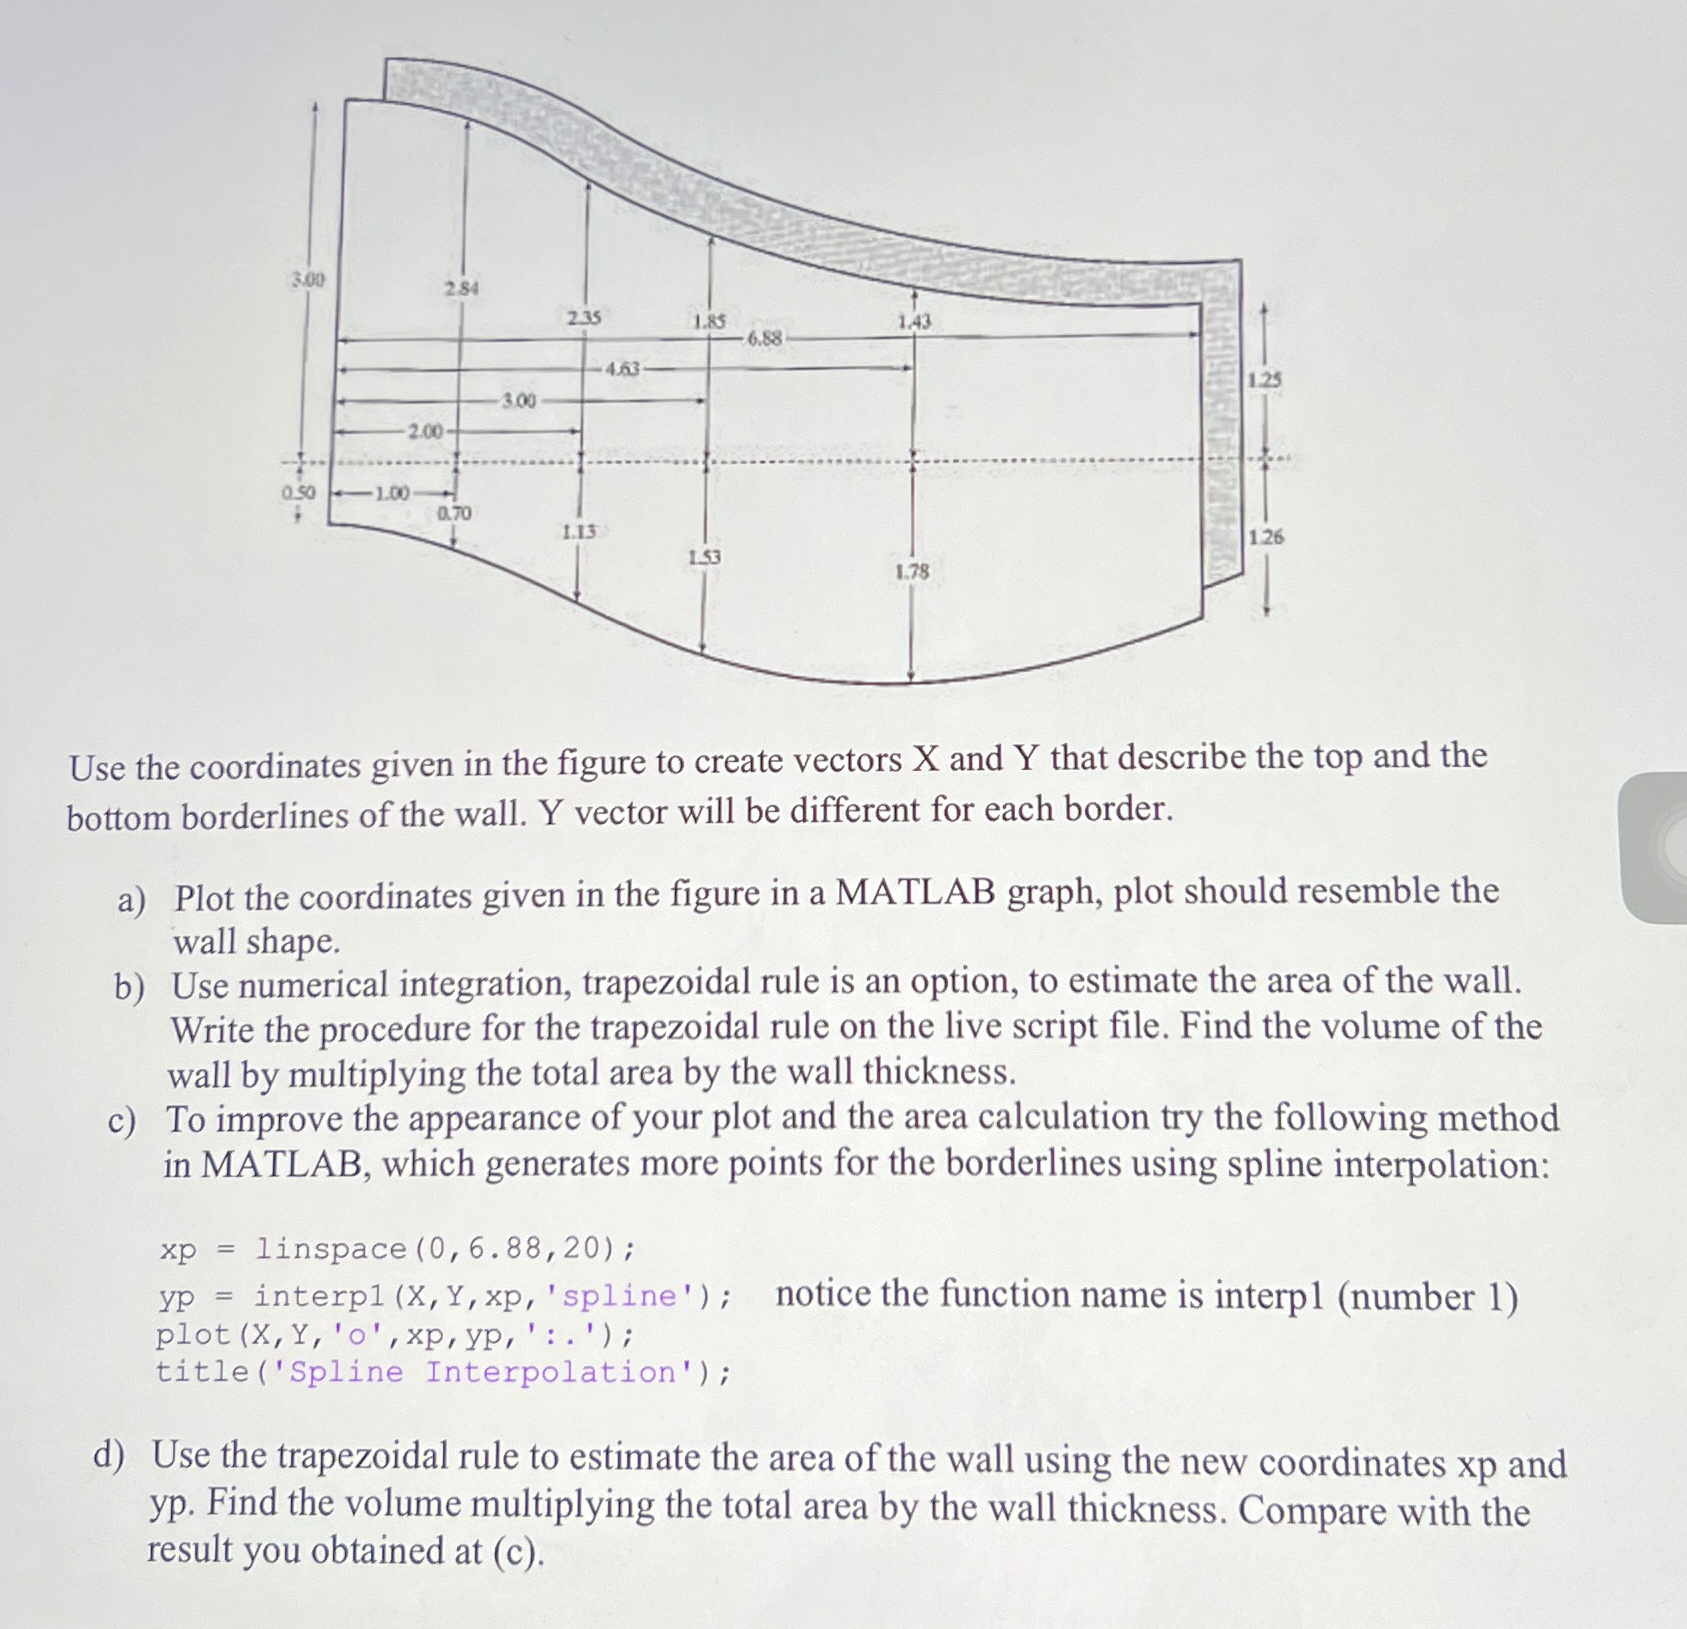
Use the coordinates given in the figure to create vectors and that describe the top and the bottom borderlines of the wall. vector will be different for each border.
a Plot the coordinates given in the figure in a MATLAB graph, plot should resemble the wall shape.
b Use numerical integration, trapezoidal rule is an option, to estimate the area of the wall. Write the procedure for the trapezoidal rule on the live script file. Find the volume of the wall by multiplying the total area by the wall thickness.
c To improve the appearance of your plot and the area calculation try the following method in MATLAB, which generates more points for the borderlines using spline interpolation:d Use the trapezoidal rule to estimate the area of the wall using the new coordinates xp and yp Find the volume multiplying the total area by the wall thickness. Compare with the result
you obtained at c
MATLAB PLEASE
Step by Step Solution
There are 3 Steps involved in it
1 Expert Approved Answer
Step: 1 Unlock

Question Has Been Solved by an Expert!
Get step-by-step solutions from verified subject matter experts
Step: 2 Unlock
Step: 3 Unlock