

Question: Use the COUNTIF function to construct frequency distributions for gender, preferred style, and purchase influence for the data provided, develop column charts to express the
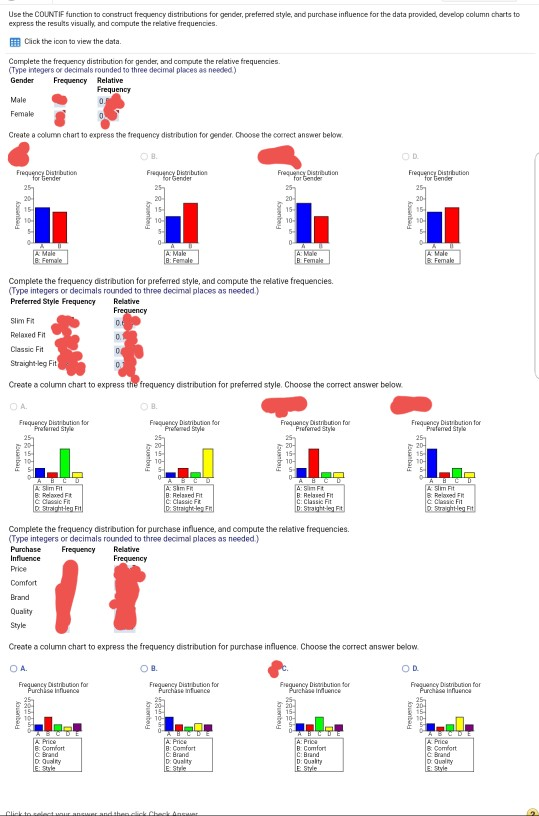
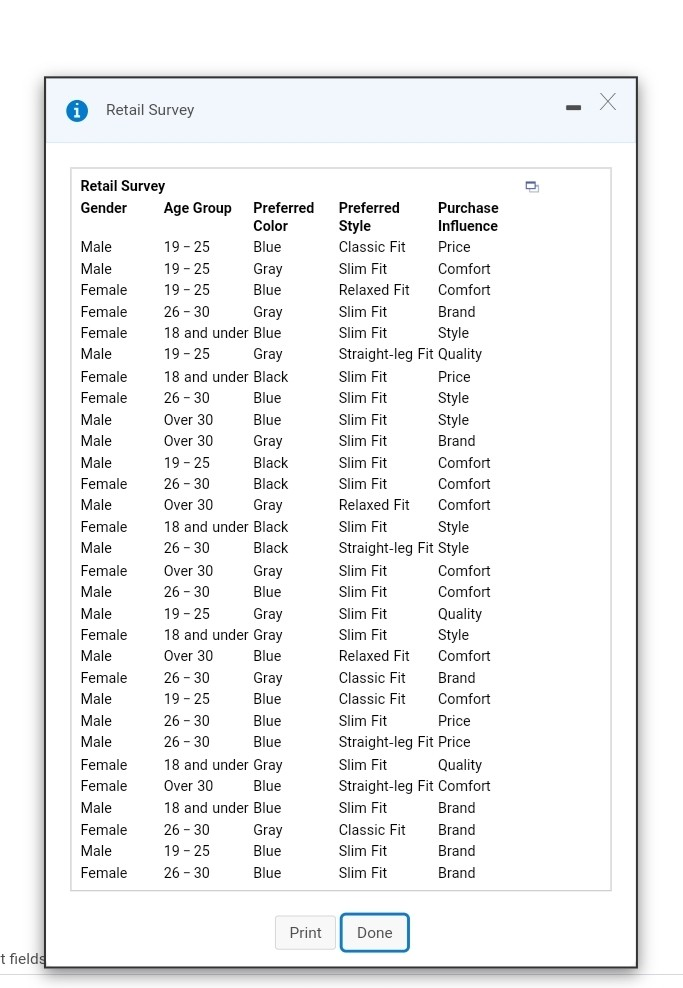
Use the COUNTIF function to construct frequency distributions for gender, preferred style, and purchase influence for the data provided, develop column charts to express the results visually, and compute the relative frequencies. F Click the icon to view the data Complete the frequency distribution for gender, and compute the relative frequencies. (Type integers or decimals rounded to three decimal places as needed) Gender Frequency Relative Frequency Male Female Create a column chart to express the frequency distribution for gender. Choose the correct answer below Frequency Dibution for tender 25 Frequency Depribution for Gender Frequency Distribution for Gender Frequency Disbution for tender 25 20 20 15 Frequency 151 104 5 20 15 10 Frequency be Frequency 10 A: Male A Mile Female B: Female A: Moe B Female B Female Complete the frequency distribution for preferred style, and compute the relative frequencies. (Type integers or decimals rounded to three decimal places as needed.) Preferred Style Frequency Relative Frequency Slim F 06 Relaxed Fit Classic Fit Straight leg Fit 0 Create a column chart to express the frequency distribution for preferred style. Choose the correct answer below. OA Frequency Dibution for Preferred Style 25 Frequency Dribution for Prod Style Frequency Distribution for Preferred Style Frequency Diabution for Preferred to 20-4 buanbau Frequency Frequency A Slim Fit B Read Cli 0 Sraghet A Sim Fit A: Sim B: Relaxed Fit B: Relat B Relaxed Fit C: Cles FR C: Classic FK C. Classic Fit Straigteleg Fel D Stealight-ley Ft Complete the frequency distribution for purchase influence, and compute the relative frequencies. (Type integers or decimals rounded to three decimal places as needed) Purchase Frequency Relative Influence Frequency Price Comfort Brand Quality Style Create a column chart to express the frequency distribution for purchase influence. Choose the correct answer below. OA OB OD Frequency Distribution for Purchase in Frequency Distribution for Purchase we Frequency Davibution for Fuchside Frequency Distribution for Purchi inance Frequency Frequency PE Frequency re A Pic A Price B: Comfort c. Brand D G A Price B: Comfort C: Brand D: Quality JE State A: PRIO B Comfort C: Brand D: Quality I Comfort e Brand 0 Gually Ciao Retail Survey Retail Survey Gender Age Group Preferred Color Male 19 - 25 Blue Male 19-25 Gray Female 19-25 Blue Female 26 - 30 Gray Female 18 and under Blue Male 19-25 Gray Female 18 and under Black Female 26 - 30 Blue Male Over 30 Blue Male Over 30 Gray Male 19-25 Black Female 26 - 30 Black Male Over 30 Gray Female 18 and under Black Male 26 - 30 Black Female Over 30 Gray Male 26 - 30 Blue Male 19-25 Gray Female 18 and under Gray Male Over 30 Blue Female 26 - 30 Gray Male 19 - 25 Blue Male 26 - 30 Blue Male 26 - 30 Blue Female 18 and under Gray Female Over 30 Blue Male 18 and under Blue Female 26 - 30 Gray Male 19-25 Blue Female 26 - 30 Blue Preferred Purchase Style Influence Classic Fit Price Slim Fit Comfort Relaxed Fit Comfort Slim Fit Brand Slim Fit Style Straight-leg Fit Quality Slim Fit Price Slim Fit Style Slim Fit Style Slim Fit Brand Fit Comfor Slim Fit Comfort Relaxed Fit Comfort Slim Fit Style Straight-leg Fit Style Slim Fit Comfort Slim Fit Comfort Slim Fit Quality Slim Fit Style Relaxed Fit Comfort Classic Fit Brand Classic Fit Comfort Slim Fit Price Straight leg Fit Price Slim Fit Straight leg Fit Comfort Slim Fit Brand Classic Fit Slim Fit Brand Slim Fit Brand Quality Brand Print Done t fields
Step by Step Solution
There are 3 Steps involved in it
1 Expert Approved Answer
Step: 1 Unlock

Question Has Been Solved by an Expert!
Get step-by-step solutions from verified subject matter experts
Step: 2 Unlock
Step: 3 Unlock