

Question: Use the data above to answer the following question and show how you got to the answer 1. How accurate was the demand forecast for
Use the data above to answer the following question and show how you got to the answer
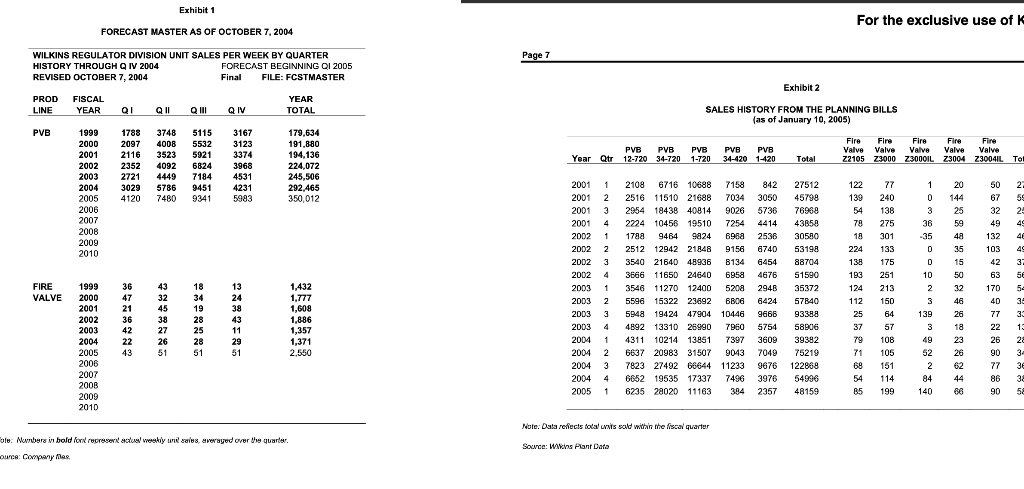
1. How accurate was the demand forecast for the first quarter of 2005?
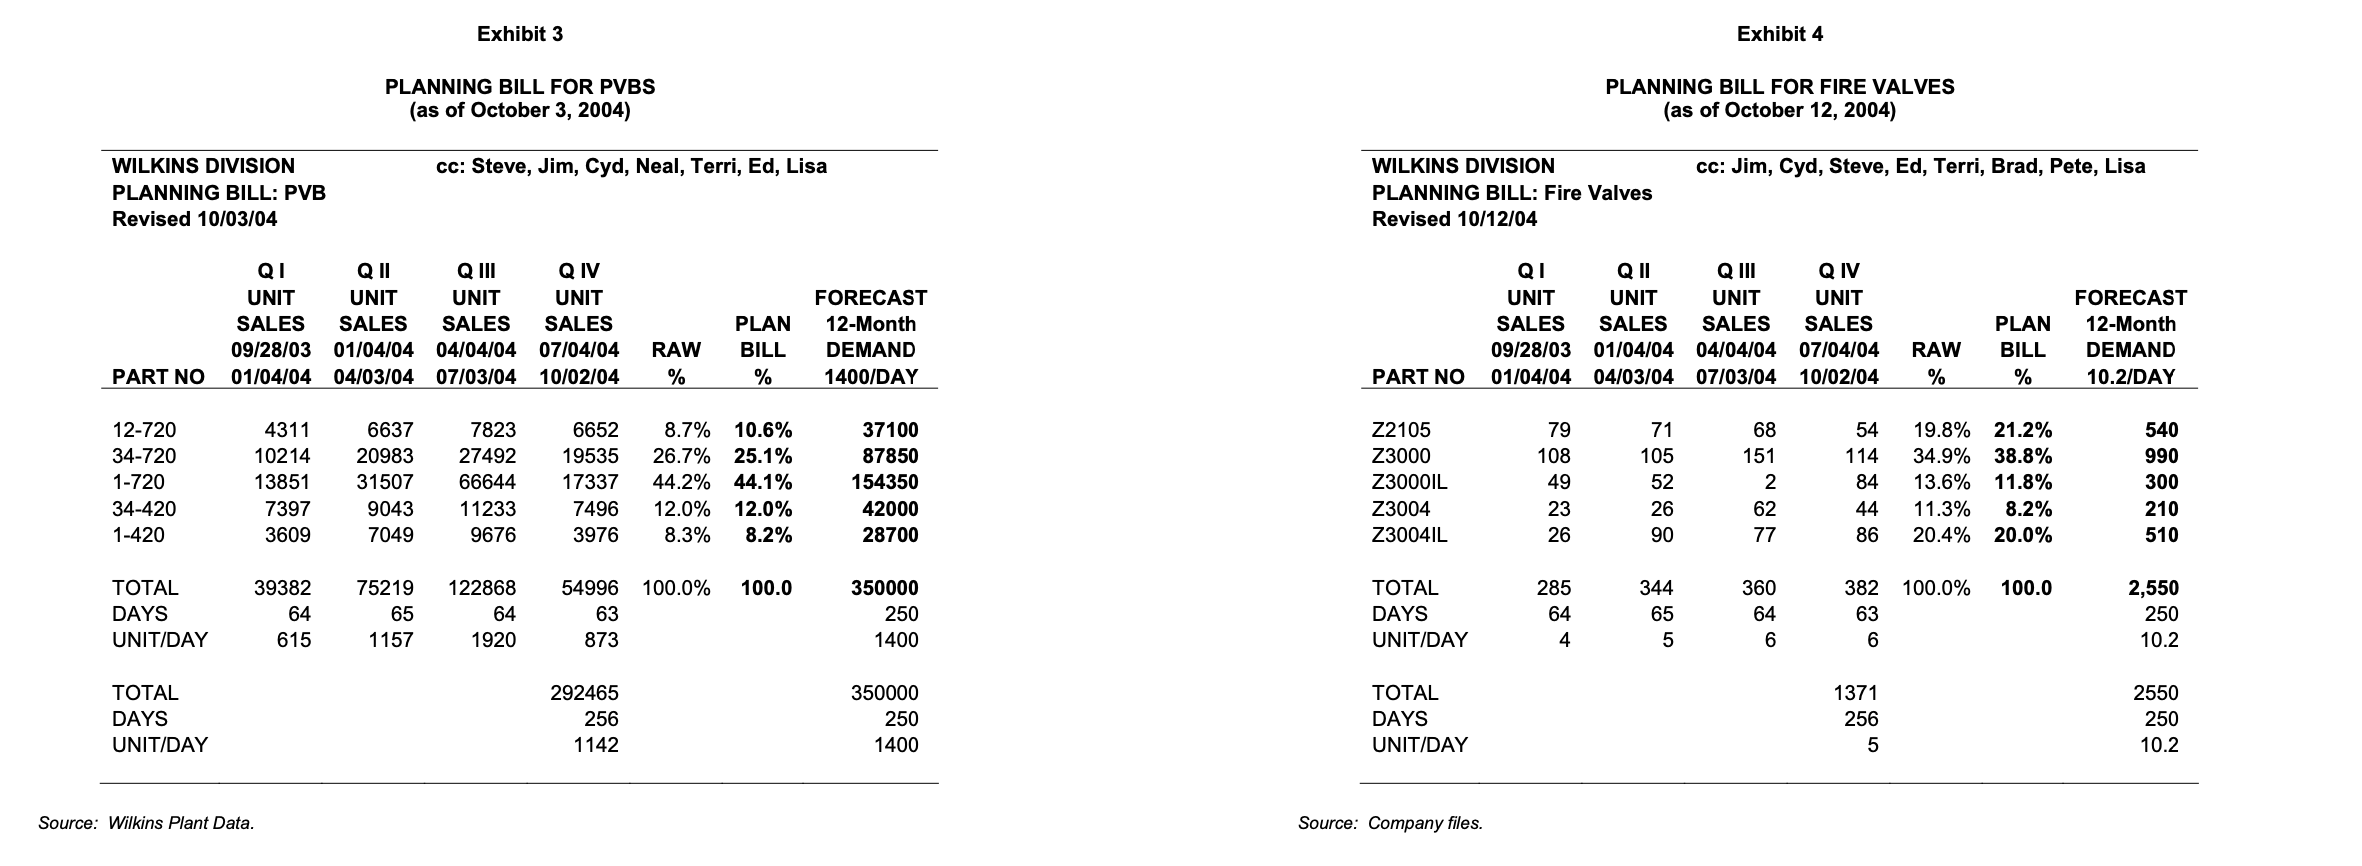
Use the forecast error and MAPE to calculate forecast accuracy. Calculate the accuracies for the fire valves and PVBs aggregate family of products as well as for each product of both families individually. Note: to disaggregate the product family forecast into the individual products use the planning bill % of Exhibits 3 and 4
Exhibit 1 For the exclusive use of FORECAST MASTER AS OF OCTOBER 7, 2004 Page 7 WILKINS REGULATOR DIVISION UNIT SALES PER WEEK BY QUARTER HISTORY THROUGH Q IV 2004 FORECAST BEGINNING QI 2005 REVISED OCTOBER 7, 2004 Final FILE: FCSTMASTER Exhibit 2 PROD LINE FISCAL YEAR YEAR TOTAL QI Q11 Q III QIV SALES HISTORY FROM THE PLANNING BILLS (as of January 10, 2005) PVB PVB 1-720 PVB PVB 34-420 1-420 Fire Fire Fire Fire Fire Valve Valve Valve Valve Valve Z2105 23000 Z30001L 23004 Z30041L Total PVB PVB Year Qtr 12-720 34-720 Tol 1788 2097 2116 2352 2721 3029 4120 1999 2000 2001 2002 2003 2004 2005 2006 2007 2008 2009 2010 3748 4008 3523 4092 4449 5786 7480 5115 5532 5921 6824 7184 9451 9341 3167 3123 3374 3968 4531 4231 5983 179,634 191,880 194,136 224,072 245,506 292.465 350,012 2108 -Nmur 842 3050 5736 4414 122 139 54 78 77 240 138 2 59 2 49 50 67 32 49 132 103 42 63 2538 18 40 6740 275 301 133 175 251 6454 2 3 4 1. 4676 2946 FIRE VALVE 2001 2001 2001 2001 2002 2002 2002 2002 2003 2003 2003 2003 2004 2004 2004 2004 2005 49 37 SE 54 35 36 47 21 36 42 22 43 6716 10688 7158 2516 11510 21688 7034 2954 18438 40914 9026 2224 10456 19510 7254 1788 9484 9824 6988 2512 12942 21848 9156 3540 21640 48936 8134 3666 11650 24640 6958 3546 11270 12400 5208 5596 15322 23692 BBOG 5948 19424 47904 10446 4892 13310 26990 7960 4311 10214 13851 7397 6637 20983 31507 9043 7823 27492 60644 11233 6652 19535 17337 7496 6235 28020 11163 394 43 32 45 38 27 26 51 2 18 34 19 28 25 28 51 1,432 1,777 1,608 1,886 1,357 1,371 6424 27512 45798 76968 43650 30580 53198 88704 51590 35372 57840 93383 58906 39392 75219 122868 54996 48159 224 138 193 124 112 25 37 1999 2000 2001 2002 2003 2004 2005 2006 2007 2008 2009 2010 13 24 38 43 11 29 51 9666 1 20 0 144 3 3 25 36 59 -35 48 0 35 D 15 10 50 2 32 3 46 139 26 3 18 49 23 52 26 2 84 44 140 06 3 4 79 170 40 77 22 26 90 213 150 64 57 108 105 151 114 199 1 2 2 3 4 1 2.550 5754 3609 7049 9676 3976 2357 71 69 54 85 33 13 28 3 3E 3 5 77 86 90 Note: Data reflects tolal unts sold within the fiscal quarter ulo: Numbers in bold Ford represent actual weekly und sales averaged over the quarter. ource: Company los Source: Ww Plan Data Exhibit 3 Exhibit 4 PLANNING BILL FOR PVBS (as of October 3, 2004) PLANNING BILL FOR FIRE VALVES (as of October 12, 2004) cc: Steve, Jim, Cyd, Neal, Terri, Ed, Lisa cc: Jim, Cyd, Steve, Ed, Terri, Brad, Pete, Lisa WILKINS DIVISION PLANNING BILL: PVB Revised 10/03/04 WILKINS DIVISION PLANNING BILL: Fire Valves Revised 10/12/04 QI Q II Q III Q IV UNIT UNIT UNIT UNIT SALES SALES SALES SALES 09/28/03 01/04/04 04/04/04 07/04/04 01/04/04 04/03/04 07/03/04 10/02/04 FORECAST 12-Month DEMAND 1400/DAY PLAN BILL % QI QII Q III Q IV UNIT UNIT UNIT UNIT SALES SALES SALES SALES 09/28/03 01/04/04 04/04/04 07/04/04 01/04/04 04/03/04 07/03/04 10/02/04 RAW % FORECAST 12-Month DEMAND 10.2/DAY PLAN BILL % RAW % PART NO PART NO 79 108 12-720 34-720 1-720 34-420 1-420 4311 10214 13851 7397 3609 6637 20983 31507 9043 7049 7823 27492 66644 11233 9676 6652 19535 17337 7496 3976 8.7% 10.6% 26.7% 25.1% 44.2% 44.1% 12.0% 12.0% 8.3% 8.2% 37100 87850 154350 42000 28700 Z2105 Z3000 Z3000IL Z3004 Z3004IL 49 23 26 71 105 52 26 90 68 151 2 62 77 54 114 84 44 86 19.8% 21.2% 34.9% 38.8% 13.6% 11.8% 11.3% 8.2% 20.4% 20.0% 540 990 300 210 510 100.0% 100.0 100.0% 100.0 TOTAL DAYS UNIT/DAY 39382 64 615 75219 65 1157 122868 64 1920 54996 63 873 350000 250 1400 TOTAL DAYS UNIT/DAY 285 64 4 344 65 5 360 64 6 382 63 6 2,550 250 10.2 TOTAL DAYS UNIT/DAY 292465 256 1142 350000 250 1400 TOTAL DAYS UNIT/DAY 1371 256 5 2550 250 10.2 Source: Wilkins Plant Data. Source: Company files. Exhibit 5 Exhibit 6 UNEMPLOYMENT RATE IN THE UNITED STATES BANK PRIME LOAN RATE IN THE UNITED STATES Oct-Dec 2000 Jan-Mar 2001 Apr-Jun 2001 Jul-Sep 2001 Oct-Dec 2001 Jan-Mar 2002 Apr-Jun 2002 Jul-Sep 2002 Oct-Dec 2002 Jan-Mar 2003 Apr-Jun 2003 Jul-Sep 2003 Oct-Dec 2003 Jan-Mar 2004 Apr-Jun 2004 Jul-Sep 2004 Oct-Dec 2004 Unemployment Rate(%) 3.90 4.23 4.40 4.83 5.53 5.70 5.83 5.73 5.87 5.83 6.13 6.13 5.87 5.67 5.57 5.43 5.43 Oct-Dec 2000 Jan-Mar 2001 Apr-Jun 2001 Jul-Sep 2001 Oct-Dec 2001 Jan-Mar 2002 Apr-Jun 2002 Jul-Sep 2002 Oct-Dec 2002 Jan-Mar 2003 Apr-Jun 2003 Jul-Sep 2003 Oct-Dec 2003 Jan-Mar 2004 Apr-Jun 2004 Jul-Sep 2004 Oct-Dec 2004 Bank Prime Loan Rate(%) 9.50 8.62 7.34 6.57 5.16 4.75 4.75 4.75 4.45 4.25 4.24 4.00 4.00 4.00 4.00 4.42 4.94 United States Unemployment Rate Rate of Interest in Money and Capital Markets 10.00 9.00 8.00 6.5 6.0 5.5 50 4.5 4.0 3.5 3.0 7.00 6.00 5.00 89 4.00 3.00 Seasonal Adjusted Unemployment Rate $ 8 -Bank Prime Rate Note: Data reflects the seasonalausted unemployment rate for people 16 years and over. The quarterly data represents the unweighted average of the monthly data Source: U.S. Department of Labor, Bureau of Labor Statistics. Note: Figures are based on the rate posted by mjlonty of top 25 (by assets in domestic offices insured U.S.-chartered commercial barika. Prime is one of several beseries vsed by banks to price short-term business loans. Not Sesonally adjusted Quarterly guras are based on the unweighted average of the many rates, which include each calander day in the month Source: Federal Reserve Statistical Release, H 15, Selected interest Rates Exhibit 7 NEW PRIVATELY OWNED HOUSING UNITS STARTED IN THE UNITED STATES (in 000s) Oct-Dec 2000 Jan-Mar 2001 Apr-Jun 2001 Jul-Sep 2001 Oct-Dec 2001 Jan-Mar 2002 Apr-Jun 2002 Jul-Sep 2002 Oct-Dec 2002 Jan-Mar 2003 Apr-Jun 2003 Jul-Sep 2003 Oct-Dec 2003 Jan-Mar 2004 Apr-Jun 2004 Jul-Sep 2004 Oct-Dec 2004 Single-Unit Housing Starts 275 274 374 341 285 293 386 361 319 304 406 412 377 345 456 440 370 Multi-Unit Total Housing Starts Housing Starts 82 357 74 348 87 461 88 429 81 366 76 369 89 475 98 459 84 403 71 375 84 490 99 511 95 472 80 425 84 540 92 532 90 460 New Privately owned Housing United Started 600 500 400 300 200 100 0 Oct-00 Jan-01 Apr-01 Jul-01 Oct-01 Jan-02 Apr-02 surve Oct-02 Jan-03 Apr-03 Apr-03 Jul-03 Oct-03 Jan-04 Apr-04 Jul-04 Oct-04 - Single Units Multi-Units Total Source: U.S. Census Bureau: Manufacturing, Mining and Construction Statistics Exhibit 1 For the exclusive use of FORECAST MASTER AS OF OCTOBER 7, 2004 Page 7 WILKINS REGULATOR DIVISION UNIT SALES PER WEEK BY QUARTER HISTORY THROUGH Q IV 2004 FORECAST BEGINNING QI 2005 REVISED OCTOBER 7, 2004 Final FILE: FCSTMASTER Exhibit 2 PROD LINE FISCAL YEAR YEAR TOTAL QI Q11 Q III QIV SALES HISTORY FROM THE PLANNING BILLS (as of January 10, 2005) PVB PVB 1-720 PVB PVB 34-420 1-420 Fire Fire Fire Fire Fire Valve Valve Valve Valve Valve Z2105 23000 Z30001L 23004 Z30041L Total PVB PVB Year Qtr 12-720 34-720 Tol 1788 2097 2116 2352 2721 3029 4120 1999 2000 2001 2002 2003 2004 2005 2006 2007 2008 2009 2010 3748 4008 3523 4092 4449 5786 7480 5115 5532 5921 6824 7184 9451 9341 3167 3123 3374 3968 4531 4231 5983 179,634 191,880 194,136 224,072 245,506 292.465 350,012 2108 -Nmur 842 3050 5736 4414 122 139 54 78 77 240 138 2 59 2 49 50 67 32 49 132 103 42 63 2538 18 40 6740 275 301 133 175 251 6454 2 3 4 1. 4676 2946 FIRE VALVE 2001 2001 2001 2001 2002 2002 2002 2002 2003 2003 2003 2003 2004 2004 2004 2004 2005 49 37 SE 54 35 36 47 21 36 42 22 43 6716 10688 7158 2516 11510 21688 7034 2954 18438 40914 9026 2224 10456 19510 7254 1788 9484 9824 6988 2512 12942 21848 9156 3540 21640 48936 8134 3666 11650 24640 6958 3546 11270 12400 5208 5596 15322 23692 BBOG 5948 19424 47904 10446 4892 13310 26990 7960 4311 10214 13851 7397 6637 20983 31507 9043 7823 27492 60644 11233 6652 19535 17337 7496 6235 28020 11163 394 43 32 45 38 27 26 51 2 18 34 19 28 25 28 51 1,432 1,777 1,608 1,886 1,357 1,371 6424 27512 45798 76968 43650 30580 53198 88704 51590 35372 57840 93383 58906 39392 75219 122868 54996 48159 224 138 193 124 112 25 37 1999 2000 2001 2002 2003 2004 2005 2006 2007 2008 2009 2010 13 24 38 43 11 29 51 9666 1 20 0 144 3 3 25 36 59 -35 48 0 35 D 15 10 50 2 32 3 46 139 26 3 18 49 23 52 26 2 84 44 140 06 3 4 79 170 40 77 22 26 90 213 150 64 57 108 105 151 114 199 1 2 2 3 4 1 2.550 5754 3609 7049 9676 3976 2357 71 69 54 85 33 13 28 3 3E 3 5 77 86 90 Note: Data reflects tolal unts sold within the fiscal quarter ulo: Numbers in bold Ford represent actual weekly und sales averaged over the quarter. ource: Company los Source: Ww Plan Data Exhibit 3 Exhibit 4 PLANNING BILL FOR PVBS (as of October 3, 2004) PLANNING BILL FOR FIRE VALVES (as of October 12, 2004) cc: Steve, Jim, Cyd, Neal, Terri, Ed, Lisa cc: Jim, Cyd, Steve, Ed, Terri, Brad, Pete, Lisa WILKINS DIVISION PLANNING BILL: PVB Revised 10/03/04 WILKINS DIVISION PLANNING BILL: Fire Valves Revised 10/12/04 QI Q II Q III Q IV UNIT UNIT UNIT UNIT SALES SALES SALES SALES 09/28/03 01/04/04 04/04/04 07/04/04 01/04/04 04/03/04 07/03/04 10/02/04 FORECAST 12-Month DEMAND 1400/DAY PLAN BILL % QI QII Q III Q IV UNIT UNIT UNIT UNIT SALES SALES SALES SALES 09/28/03 01/04/04 04/04/04 07/04/04 01/04/04 04/03/04 07/03/04 10/02/04 RAW % FORECAST 12-Month DEMAND 10.2/DAY PLAN BILL % RAW % PART NO PART NO 79 108 12-720 34-720 1-720 34-420 1-420 4311 10214 13851 7397 3609 6637 20983 31507 9043 7049 7823 27492 66644 11233 9676 6652 19535 17337 7496 3976 8.7% 10.6% 26.7% 25.1% 44.2% 44.1% 12.0% 12.0% 8.3% 8.2% 37100 87850 154350 42000 28700 Z2105 Z3000 Z3000IL Z3004 Z3004IL 49 23 26 71 105 52 26 90 68 151 2 62 77 54 114 84 44 86 19.8% 21.2% 34.9% 38.8% 13.6% 11.8% 11.3% 8.2% 20.4% 20.0% 540 990 300 210 510 100.0% 100.0 100.0% 100.0 TOTAL DAYS UNIT/DAY 39382 64 615 75219 65 1157 122868 64 1920 54996 63 873 350000 250 1400 TOTAL DAYS UNIT/DAY 285 64 4 344 65 5 360 64 6 382 63 6 2,550 250 10.2 TOTAL DAYS UNIT/DAY 292465 256 1142 350000 250 1400 TOTAL DAYS UNIT/DAY 1371 256 5 2550 250 10.2 Source: Wilkins Plant Data. Source: Company files. Exhibit 5 Exhibit 6 UNEMPLOYMENT RATE IN THE UNITED STATES BANK PRIME LOAN RATE IN THE UNITED STATES Oct-Dec 2000 Jan-Mar 2001 Apr-Jun 2001 Jul-Sep 2001 Oct-Dec 2001 Jan-Mar 2002 Apr-Jun 2002 Jul-Sep 2002 Oct-Dec 2002 Jan-Mar 2003 Apr-Jun 2003 Jul-Sep 2003 Oct-Dec 2003 Jan-Mar 2004 Apr-Jun 2004 Jul-Sep 2004 Oct-Dec 2004 Unemployment Rate(%) 3.90 4.23 4.40 4.83 5.53 5.70 5.83 5.73 5.87 5.83 6.13 6.13 5.87 5.67 5.57 5.43 5.43 Oct-Dec 2000 Jan-Mar 2001 Apr-Jun 2001 Jul-Sep 2001 Oct-Dec 2001 Jan-Mar 2002 Apr-Jun 2002 Jul-Sep 2002 Oct-Dec 2002 Jan-Mar 2003 Apr-Jun 2003 Jul-Sep 2003 Oct-Dec 2003 Jan-Mar 2004 Apr-Jun 2004 Jul-Sep 2004 Oct-Dec 2004 Bank Prime Loan Rate(%) 9.50 8.62 7.34 6.57 5.16 4.75 4.75 4.75 4.45 4.25 4.24 4.00 4.00 4.00 4.00 4.42 4.94 United States Unemployment Rate Rate of Interest in Money and Capital Markets 10.00 9.00 8.00 6.5 6.0 5.5 50 4.5 4.0 3.5 3.0 7.00 6.00 5.00 89 4.00 3.00 Seasonal Adjusted Unemployment Rate $ 8 -Bank Prime Rate Note: Data reflects the seasonalausted unemployment rate for people 16 years and over. The quarterly data represents the unweighted average of the monthly data Source: U.S. Department of Labor, Bureau of Labor Statistics. Note: Figures are based on the rate posted by mjlonty of top 25 (by assets in domestic offices insured U.S.-chartered commercial barika. Prime is one of several beseries vsed by banks to price short-term business loans. Not Sesonally adjusted Quarterly guras are based on the unweighted average of the many rates, which include each calander day in the month Source: Federal Reserve Statistical Release, H 15, Selected interest Rates Exhibit 7 NEW PRIVATELY OWNED HOUSING UNITS STARTED IN THE UNITED STATES (in 000s) Oct-Dec 2000 Jan-Mar 2001 Apr-Jun 2001 Jul-Sep 2001 Oct-Dec 2001 Jan-Mar 2002 Apr-Jun 2002 Jul-Sep 2002 Oct-Dec 2002 Jan-Mar 2003 Apr-Jun 2003 Jul-Sep 2003 Oct-Dec 2003 Jan-Mar 2004 Apr-Jun 2004 Jul-Sep 2004 Oct-Dec 2004 Single-Unit Housing Starts 275 274 374 341 285 293 386 361 319 304 406 412 377 345 456 440 370 Multi-Unit Total Housing Starts Housing Starts 82 357 74 348 87 461 88 429 81 366 76 369 89 475 98 459 84 403 71 375 84 490 99 511 95 472 80 425 84 540 92 532 90 460 New Privately owned Housing United Started 600 500 400 300 200 100 0 Oct-00 Jan-01 Apr-01 Jul-01 Oct-01 Jan-02 Apr-02 surve Oct-02 Jan-03 Apr-03 Apr-03 Jul-03 Oct-03 Jan-04 Apr-04 Jul-04 Oct-04 - Single Units Multi-Units Total Source: U.S. Census Bureau: Manufacturing, Mining and Construction StatisticsStep by Step Solution
There are 3 Steps involved in it
1 Expert Approved Answer
Step: 1 Unlock

Question Has Been Solved by an Expert!
Get step-by-step solutions from verified subject matter experts
Step: 2 Unlock
Step: 3 Unlock