

Question: Use the data above to complete this assignment. In the Excel file, you have two monthly price series, one for S&P500 index (the market index)
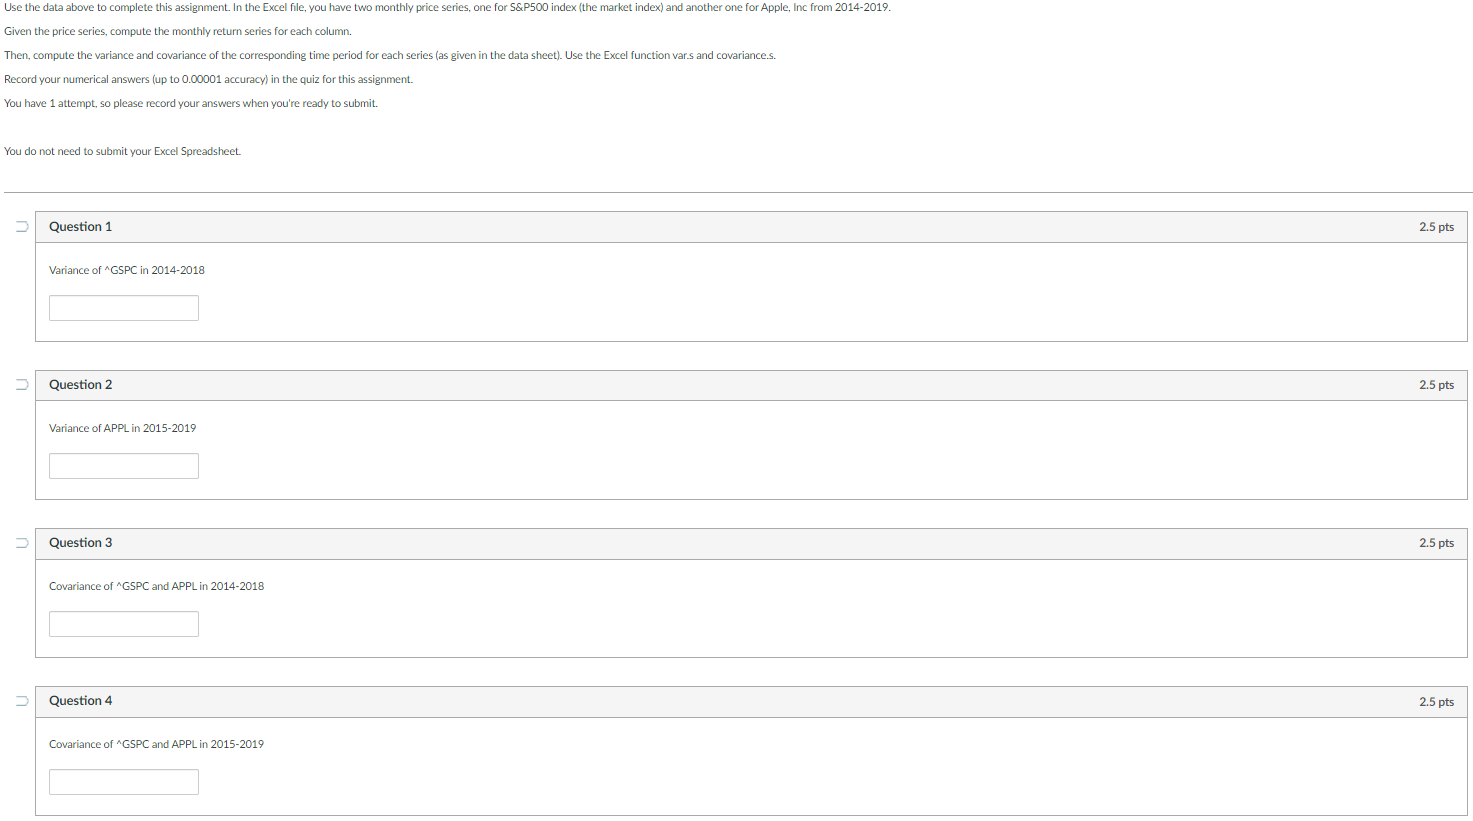
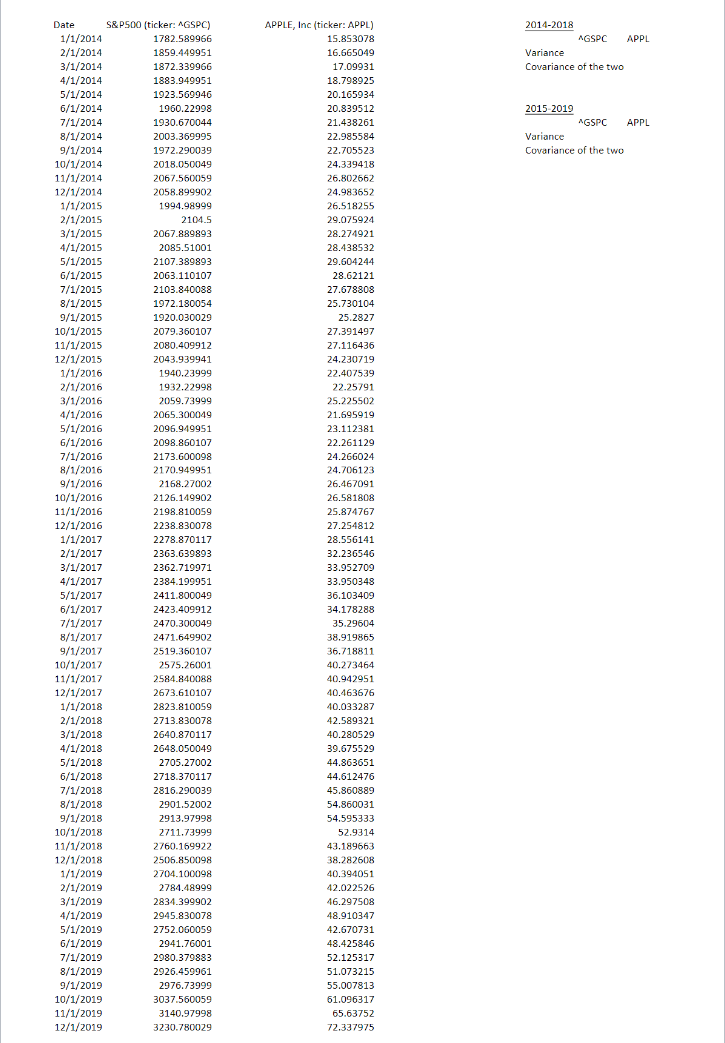
Use the data above to complete this assignment. In the Excel file, you have two monthly price series, one for S&P500 index (the market index) and another one for Apple, Inc from 2014-2019. Given the price series, compute the monthly return series for each column. Then, compute the variance and covariance of the corresponding time period for each series (as given in the data sheet). Use the Excel function vars and covariance.s. Record your numerical answers (up to 0.00001 accuracy) in the quiz for this assignment. You have 1 attempt, so please record your answers when you're ready to submit. You do not need to submit your Excel Spreadsheet Question 1 2.5 pts Variance of GSPC in 2014-2018 Question 2 2.5 pts Variance of APPL in 2015-2019 Question 3 2.5 pts Covariance of GSPC and APPL in 2014-2018 Question 4 2.5 pts Covariance of GSPC and APPL in 2015-2019 2014-2018 AGSPC APPL Variance Covariance of the two 2015 2019 AGSPC APPL Variance Covariance of the two Date S&P500 (ticker: AGSPC) 1/1/2014 1782.589966 2/1/2014 1859.449951 3/1/2014 1872.339966 4/1/2014 1883.949951 5/1/2014 1923.569946 6/1/2014 1960.22998 7/1/2014 1930.670044 8/1/2014 2003.369995 9/1/2014 1972.290039 10/1/2014 2018.050049 11/1/2014 2067.560059 12/1/2014 2058.899902 1/1/2015 1994.98999 2/1/2015 2104.5 3/1/2015 2067.889893 4/1/2015 2085.51001 5/1/2015 2107.389893 6/1/2015 2063.110107 7/1/2015 2103.840088 8/1/2015 1972.180054 9/1/2015 1920.030029 10/1/2015 2079.360107 11/1/2015 2080.409912 12/1/2015 2043.939941 1/1/2016 1940.23999 2/1/2016 1932.22998 3/1/2016 2059.73999 4/1/2016 2065.300049 5/1/2016 2096.949951 6/1/2016 2098.860107 7/1/2016 2173.600098 8/1/2016 2170.949951 9/1/2016 2168.27002 10/1/2016 2126.149902 11/1/2016 2198.810059 12/1/2016 2238.830078 1/1/2017 2278.870117 2/1/2017 2363.639893 3/1/2017 2362.719971 4/1/2017 2384.199951 5/1/2017 2411.800049 6/1/2017 2423.409912 7/1/2017 2470.300049 8/1/2017 2471.649902 9/1/2017 2519.350107 10/1/2017 2575.26001 11/1/2017 2584.840088 12/1/2017 2673.610107 1/1/2018 2823.810059 2/1/2018 2713.830078 3/1/2018 2640.870117 4/1/2018 2648.050049 5/1/2018 2705.27002 6/1/2018 2718.370117 7/1/2018 2816 290039 8/1/2018 2901.52002 9/1/2018 2913.97998 10/1/2018 2711.73999 11/1/2018 2760.169922 12/1/2018 2506.850098 1/1/2019 2704.100098 2/1/2019 2784.48999 3/1/2019 2834.399902 4/1/2019 2945.830078 5/1/2019 2752.060059 6/1/2019 2941.76001 7/1/2019 2980.379883 8/1/2019 2926.459961 9/1/2019 2976.73999 10/1/2019 3037.560059 11/1/2019 3140.97998 12/1/2019 3230.780029 APPLE, Inc (ticker: APPL) 15.853078 16.665049 17.09931 18.798925 20.165934 20.839512 21.438261 22.985584 22.705523 24.339418 26.802662 24.983652 26.518255 29.075924 28.274921 28.438532 29.604244 28.62121 27.678808 25.730104 25.2827 27.391497 27.116436 24.230719 22.407539 22.25791 25.225502 21.695919 23.112381 22.261129 24.266024 24.706123 26.467091 26.581808 25.874767 27.254812 28.556141 32.236546 33.952709 33.950348 36.103409 34.178288 35.29604 38.919865 36.718811 40.273464 40.942951 40.463676 40.033287 42.589321 40.280529 39.675529 44.863651 44.612476 45.860889 54.860031 54.595333 52.9314 43.189663 38.282608 40.394051 42.022526 46.297508 48.910347 42.670731 48.425846 52.125317 51.073215 55.007813 61.096317 65.63752 72.337975
Step by Step Solution
There are 3 Steps involved in it

Get step-by-step solutions from verified subject matter experts