

Question: The following Table shows part of the SUMMARY RATIOS (percentage of Average Total Assets) report for Santa Clara bank and its peer group Earnings
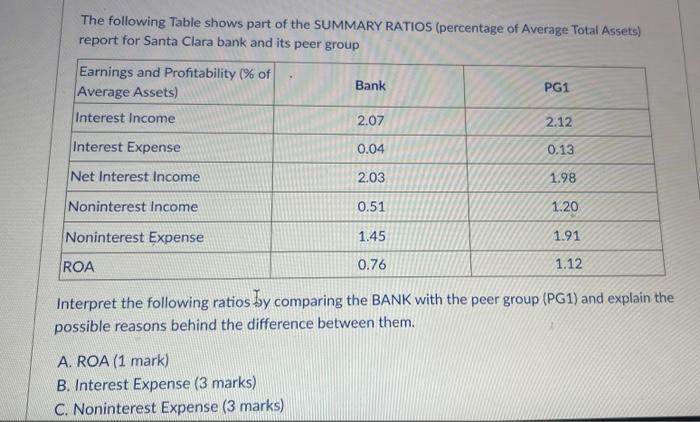
The following Table shows part of the SUMMARY RATIOS (percentage of Average Total Assets) report for Santa Clara bank and its peer group Earnings and Profitability (% of Average Assets) Interest Income Interest Expense Net Interest Income Noninterest Income Noninterest Expense Bank A. ROA (1 mark) B. Interest Expense (3 marks) C. Noninterest Expense (3 marks) 2.07 0.04 2.03 0.51 1.45 0.76 PG1 2.12 0.13 1.98 1.20 1.91 1.12 ROA Interpret the following ratios by comparing the BANK with the peer group (PG1) and explain the possible reasons behind the difference between them.
Step by Step Solution
3.47 Rating (147 Votes )
There are 3 Steps involved in it
1 Return of assets of the bank is 076 and the Peer group is 112 it is seen that the banks return on ... View full answer

Get step-by-step solutions from verified subject matter experts