

Question: Use the data file in Chapter 6 summary on page 199to answer the following questions for this independent samples t-test. You may use either Excel
Use the data file in Chapter 6 summary on page 199to answer the following questions for this independent samples t-test. You may use either Excel or calculate your answers by hand using the handouts provided in this week's Announcement. All answers must be at least 3 places past the decimal.
1. What is the average volunteering time for males?
2. What is the average volunteering time for females?
3. What is the value of t?
4. According to Table A.2, what is the critical value of t, assuming a one-tailed test and a .05 level of significance?
5. Is our t-value significant according to the value of Question 4?
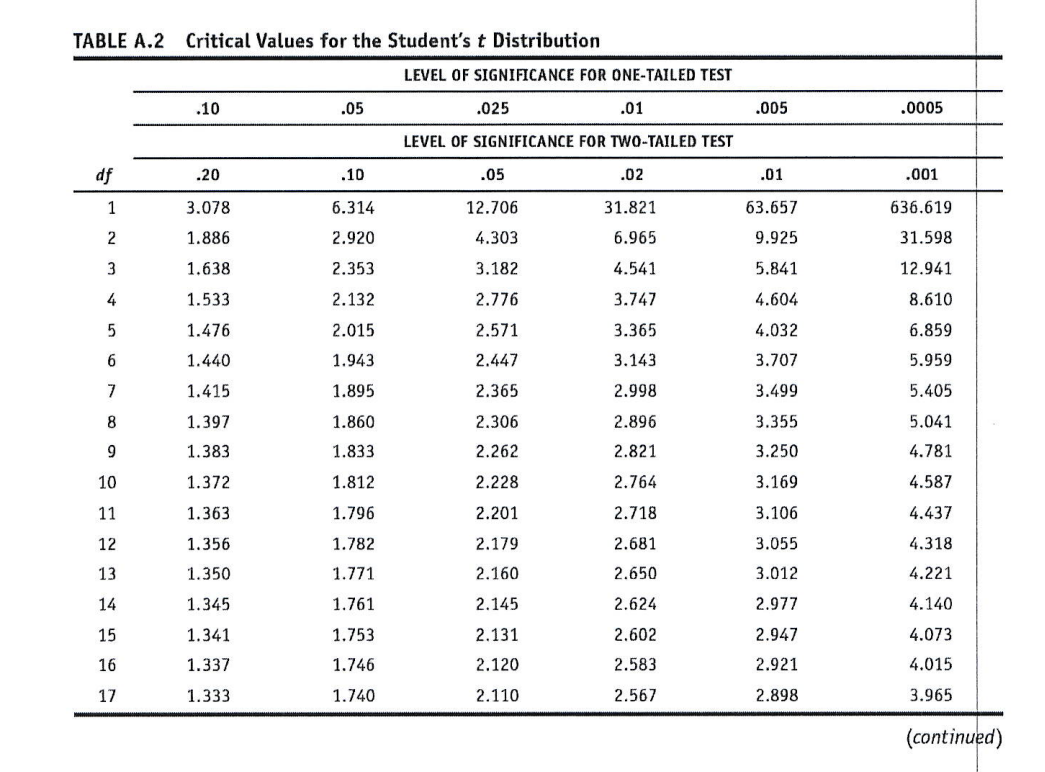
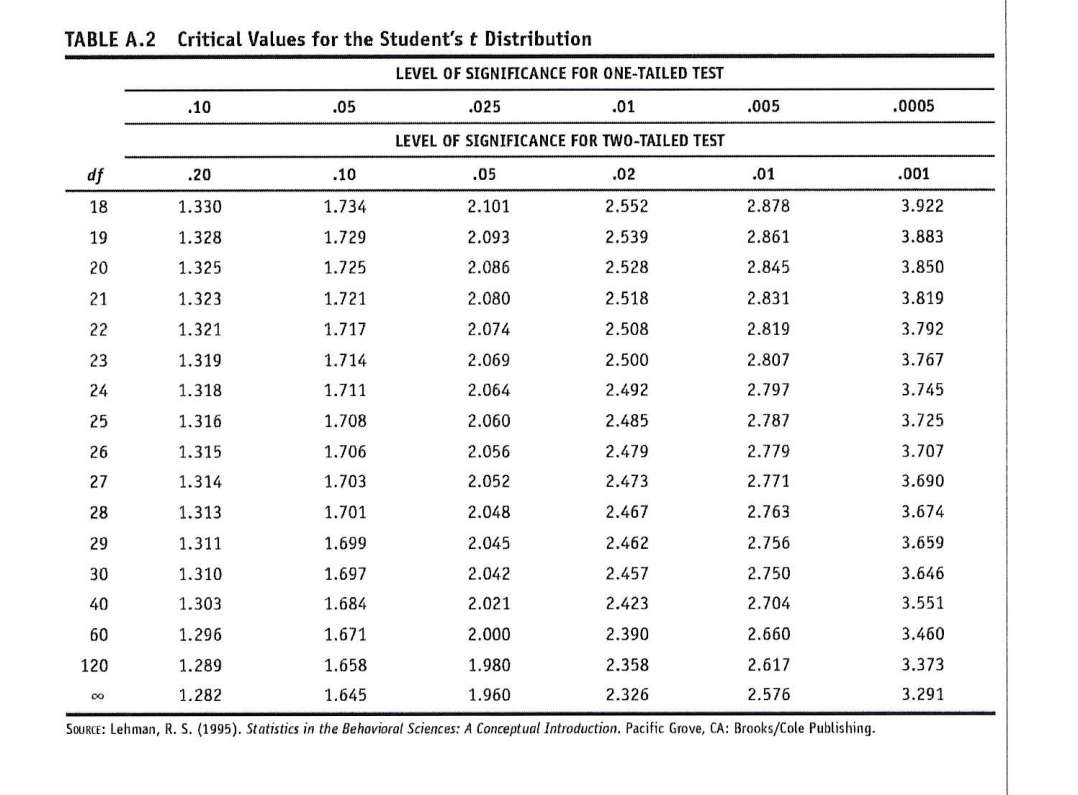
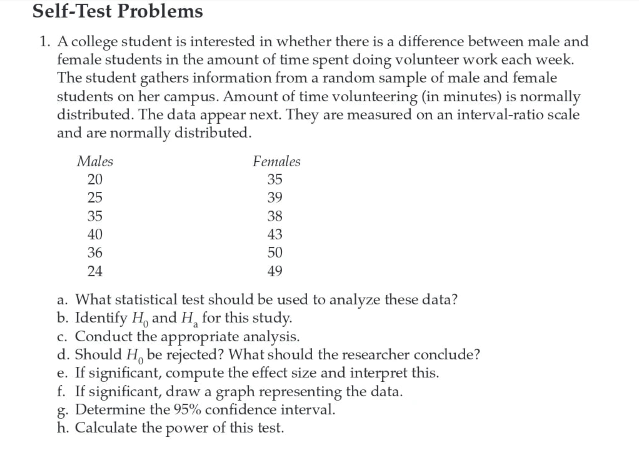
TABLE A.2 Critical Values for the Student's t Distribution LEVEL OF SIGNIFICANCE FOR ONE-TAILED TEST .10 .05 .025 .01 .005 .0005 LEVEL OF SIGNIFICANCE FOR TWO-TAILED TEST df .20 .10 05 02 .01 001 3.078 6.314 12.706 31.821 63.657 636.619 W N A 1.886 2.920 4.303 6.965 9.925 31.598 1.638 2.353 3.182 4.541 5.841 12.941 4 1.533 2.132 2.776 3.747 4.604 8.610 1.476 2.015 2.571 3.365 4.032 6.859 1.440 1.943 2.447 3.143 3.707 5.959 1.415 1.895 2.365 2.998 3.499 5.405 8 1.397 1.860 2.306 2.896 3.355 5.041 9 1.383 1.833 2.262 2.821 3.250 4.781 10 1.372 1.812 2.228 2.764 3.169 4.587 11 1.363 1.796 2.201 2.718 3.106 4.437 12 1.356 1.782 2.179 2.681 3.055 4.318 13 1.350 1.771 2.160 2.650 3.012 4.221 14 1.345 1.761 2.145 2.624 2.977 4.140 15 1.341 1.753 2.131 2.602 2.947 4.073 16 1.337 1.746 2.120 2.583 2.921 4.015 17 1.333 1.740 2.110 2.567 2.898 3.965 (continued)TABLE A.2 Critical Values for the Student's t Distribution LEVEL OF SIGNIFICANCE FOR ONE-TAILED TEST .10 .05 .025 .01 .005 0005 LEVEL OF SIGNIFICANCE FOR TWO-TAILED TEST df .20 .10 .05 .02 .01 .001 18 1.330 1.734 2.101 2.552 2.878 3.922 19 1.328 1.729 2.093 2.539 2.861 3.883 20 1.325 1.725 2.086 2.528 2.845 3.850 21 1.323 1.721 2.080 2.518 2.831 3.819 22 1.321 1.717 2.074 2.508 2.819 3.792 23 1.319 1.714 2.069 2.500 2.807 3.767 24 1.318 1.711 2.064 2.492 2.797 3.745 25 1.316 1.708 2.060 2.485 2.787 3.725 26 1.315 1.706 2.056 2.479 2.779 3.707 27 1.314 1.703 2.052 2.473 2.771 3.690 28 1.313 1.701 2.048 2.467 2.763 3.674 29 1.311 1.699 2.045 2.462 2.756 3.659 30 1.310 1.697 2.042 2.457 2.750 3.646 40 1.303 1.684 2.021 2.423 2.704 3.551 60 1.296 1.671 2.000 2.390 2.660 3.460 120 1.289 1.658 1.980 2.358 2.617 3.373 1.282 1.645 1.960 2.326 2.576 3.291 SOURCE: Lehman, R. S. (1995). Statistics in the Behavioral Sciences: A Conceptual Introduction. Pacific Grove, CA: Brooks/Cole Publishing.Self-Test Problems 1. A college student is interested in whether there is a difference between male and female students in the amount of time spent doing volunteer work each week. The student gathers information from a random sample of male and female students on her campus. Amount of time volunteering (in minutes) is normally distributed. The data appear next. They are measured on an interval-ratio scale and are normally distributed. Males Females 20 35 25 39 35 38 40 43 36 50 24 49 a. What statistical test should be used to analyze these data? b. Identify H, and H, for this study. c. Conduct the appropriate analysis. d. Should H be rejected? What should the researcher conclude? e. If significant, compute the effect size and interpret this. f. If significant, draw a graph representing the data. g. Determine the 95% confidence interval. h. Calculate the power of this test
Step by Step Solution
There are 3 Steps involved in it

Get step-by-step solutions from verified subject matter experts