

Question: Use the data file provided to draw a graph showing the following. (10 points) Measure the amount of portfolio equity investments (assets plus liabilities) as
Use the data file provided to draw a graph showing the following. (10 points)
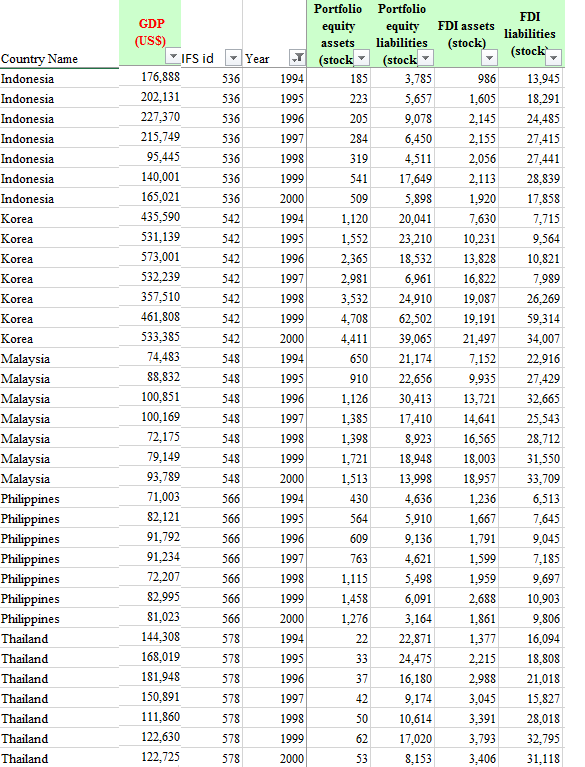
Measure the amount of portfolio equity investments (assets plus liabilities) as a percentage of GDP for the countries in the East Asian crisis (Malaysia, Thailand, Indonesia, S. Korea and Philippines) for the years 1994 to 2000.
Measure the amount of FDI as a percentage of GDP for the above countries for the same years.
*Please show work**
51985 2 7 787|7907| 7, 9, 7, 9 0 9 6 8 1 5, 821 1 3 2 981 899 c 96222, 2 1 6 2 3 6 9 1 4 1 9 3 4 6 8 9 0 2 1,411 475 34 2 91 2 1 2 3 4 101 9 7 145 In In In In In In In K K K K K K K M M M M M M M
Step by Step Solution
There are 3 Steps involved in it
1 Expert Approved Answer
Step: 1 Unlock

Question Has Been Solved by an Expert!
Get step-by-step solutions from verified subject matter experts
Step: 2 Unlock
Step: 3 Unlock