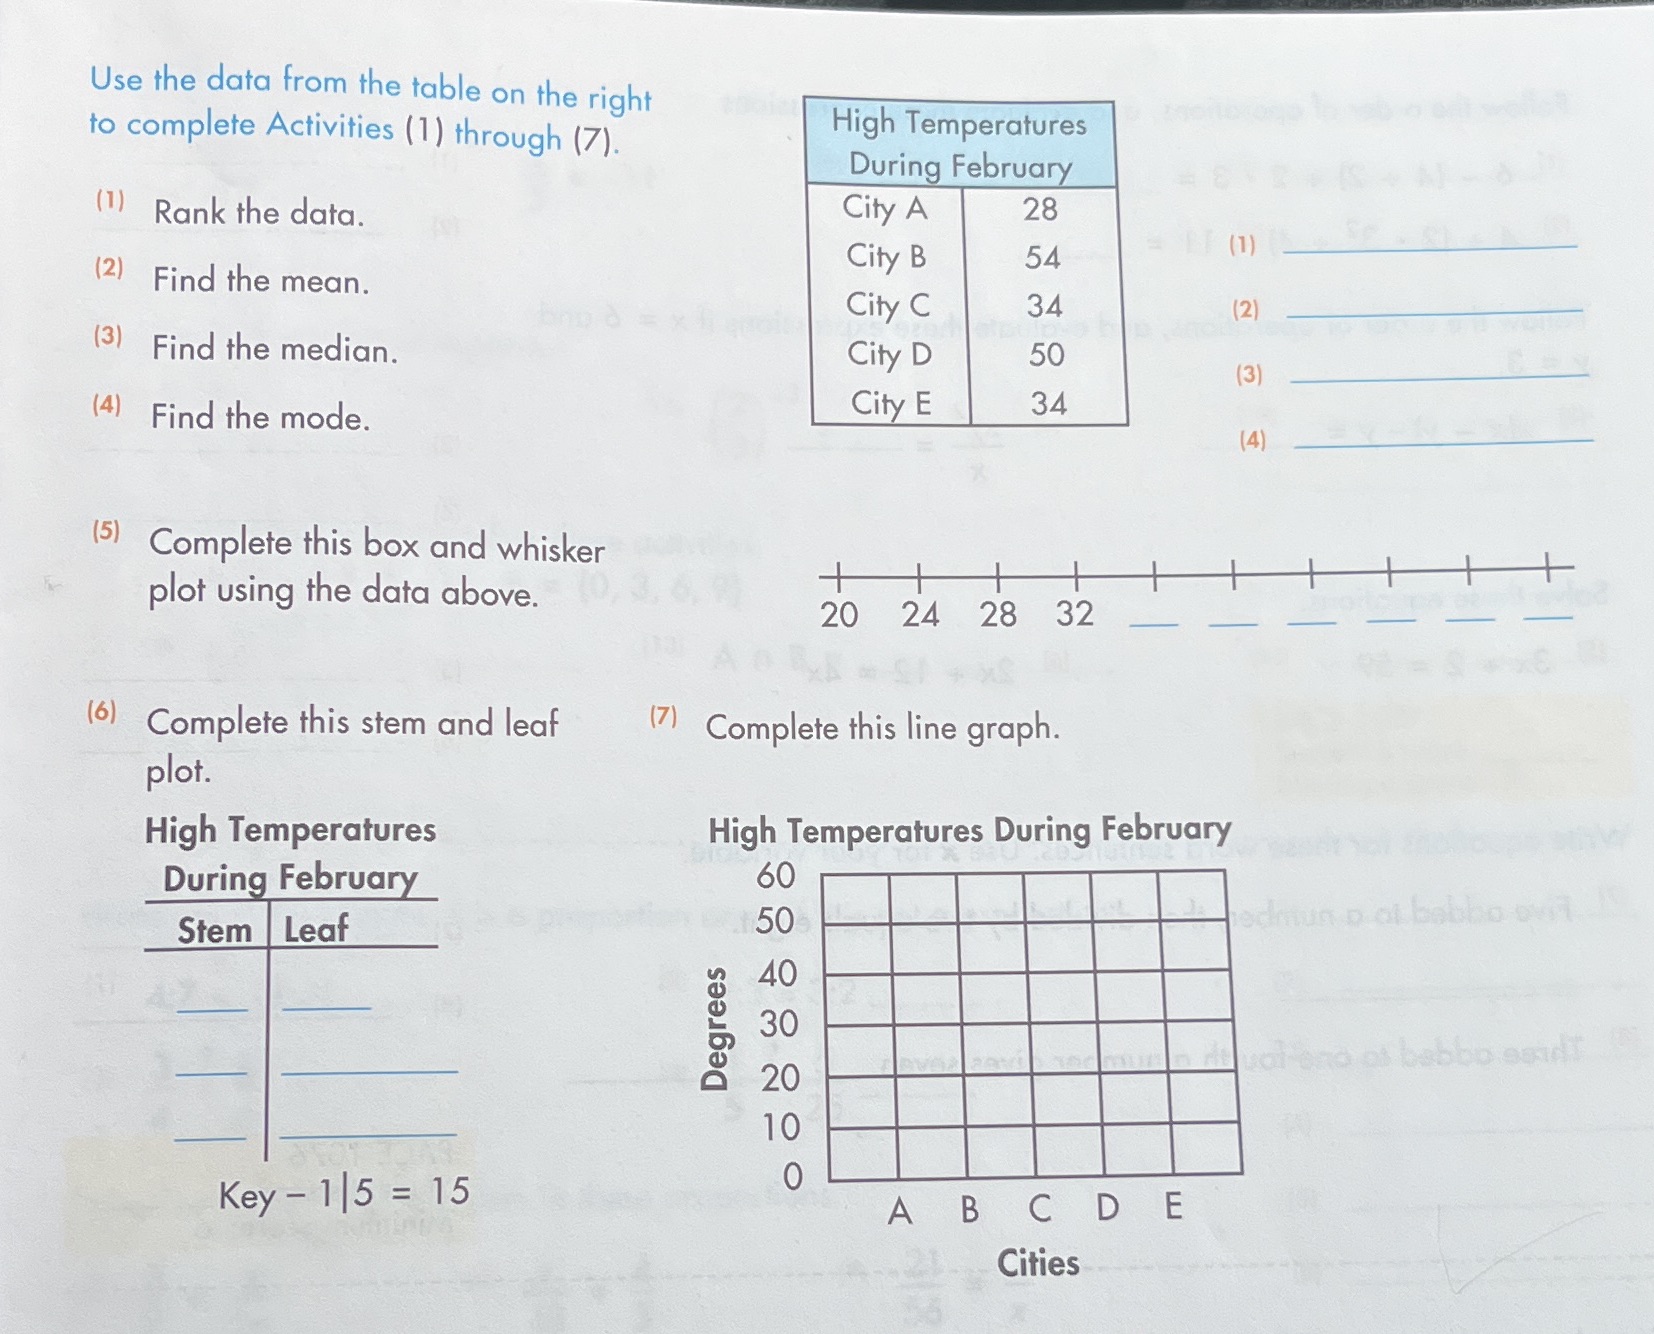
Question: Use the data from the table on the right to complete Activities (1) through (7). High Temperatures During February (1) Rank the data. City A

Use the data from the table on the right to
Use the data from the table on the right to complete Activities (1) through (7). High Temperatures During February (1) Rank the data. City A 28 City B 54 (1) (2) Find the mean. City C 34 (2) (3) Find the median. City D 50 (3) (4) Find the mode. City E 34 (4) (5) Complete this box and whisker plot using the data above. 20 24 28 32 (6) Complete this stem and leaf 17) Complete this line graph. plot. High Temperatures High Temperatures During February During February 60 Stem Leaf 50 dmun D.at babbo ovia Degrees of end of babbo asadt Key - 1 5 = 15 ABCDE Cities

Step by Step Solution

There are 3 Steps involved in it

1 Expert Approved Answer
Step: 1 Unlock blur-text-image
Question Has Been Solved by an Expert!

Get step-by-step solutions from verified subject matter experts

Step: 2 Unlock
Step: 3 Unlock

Students Have Also Explored These Related Mathematics Questions!