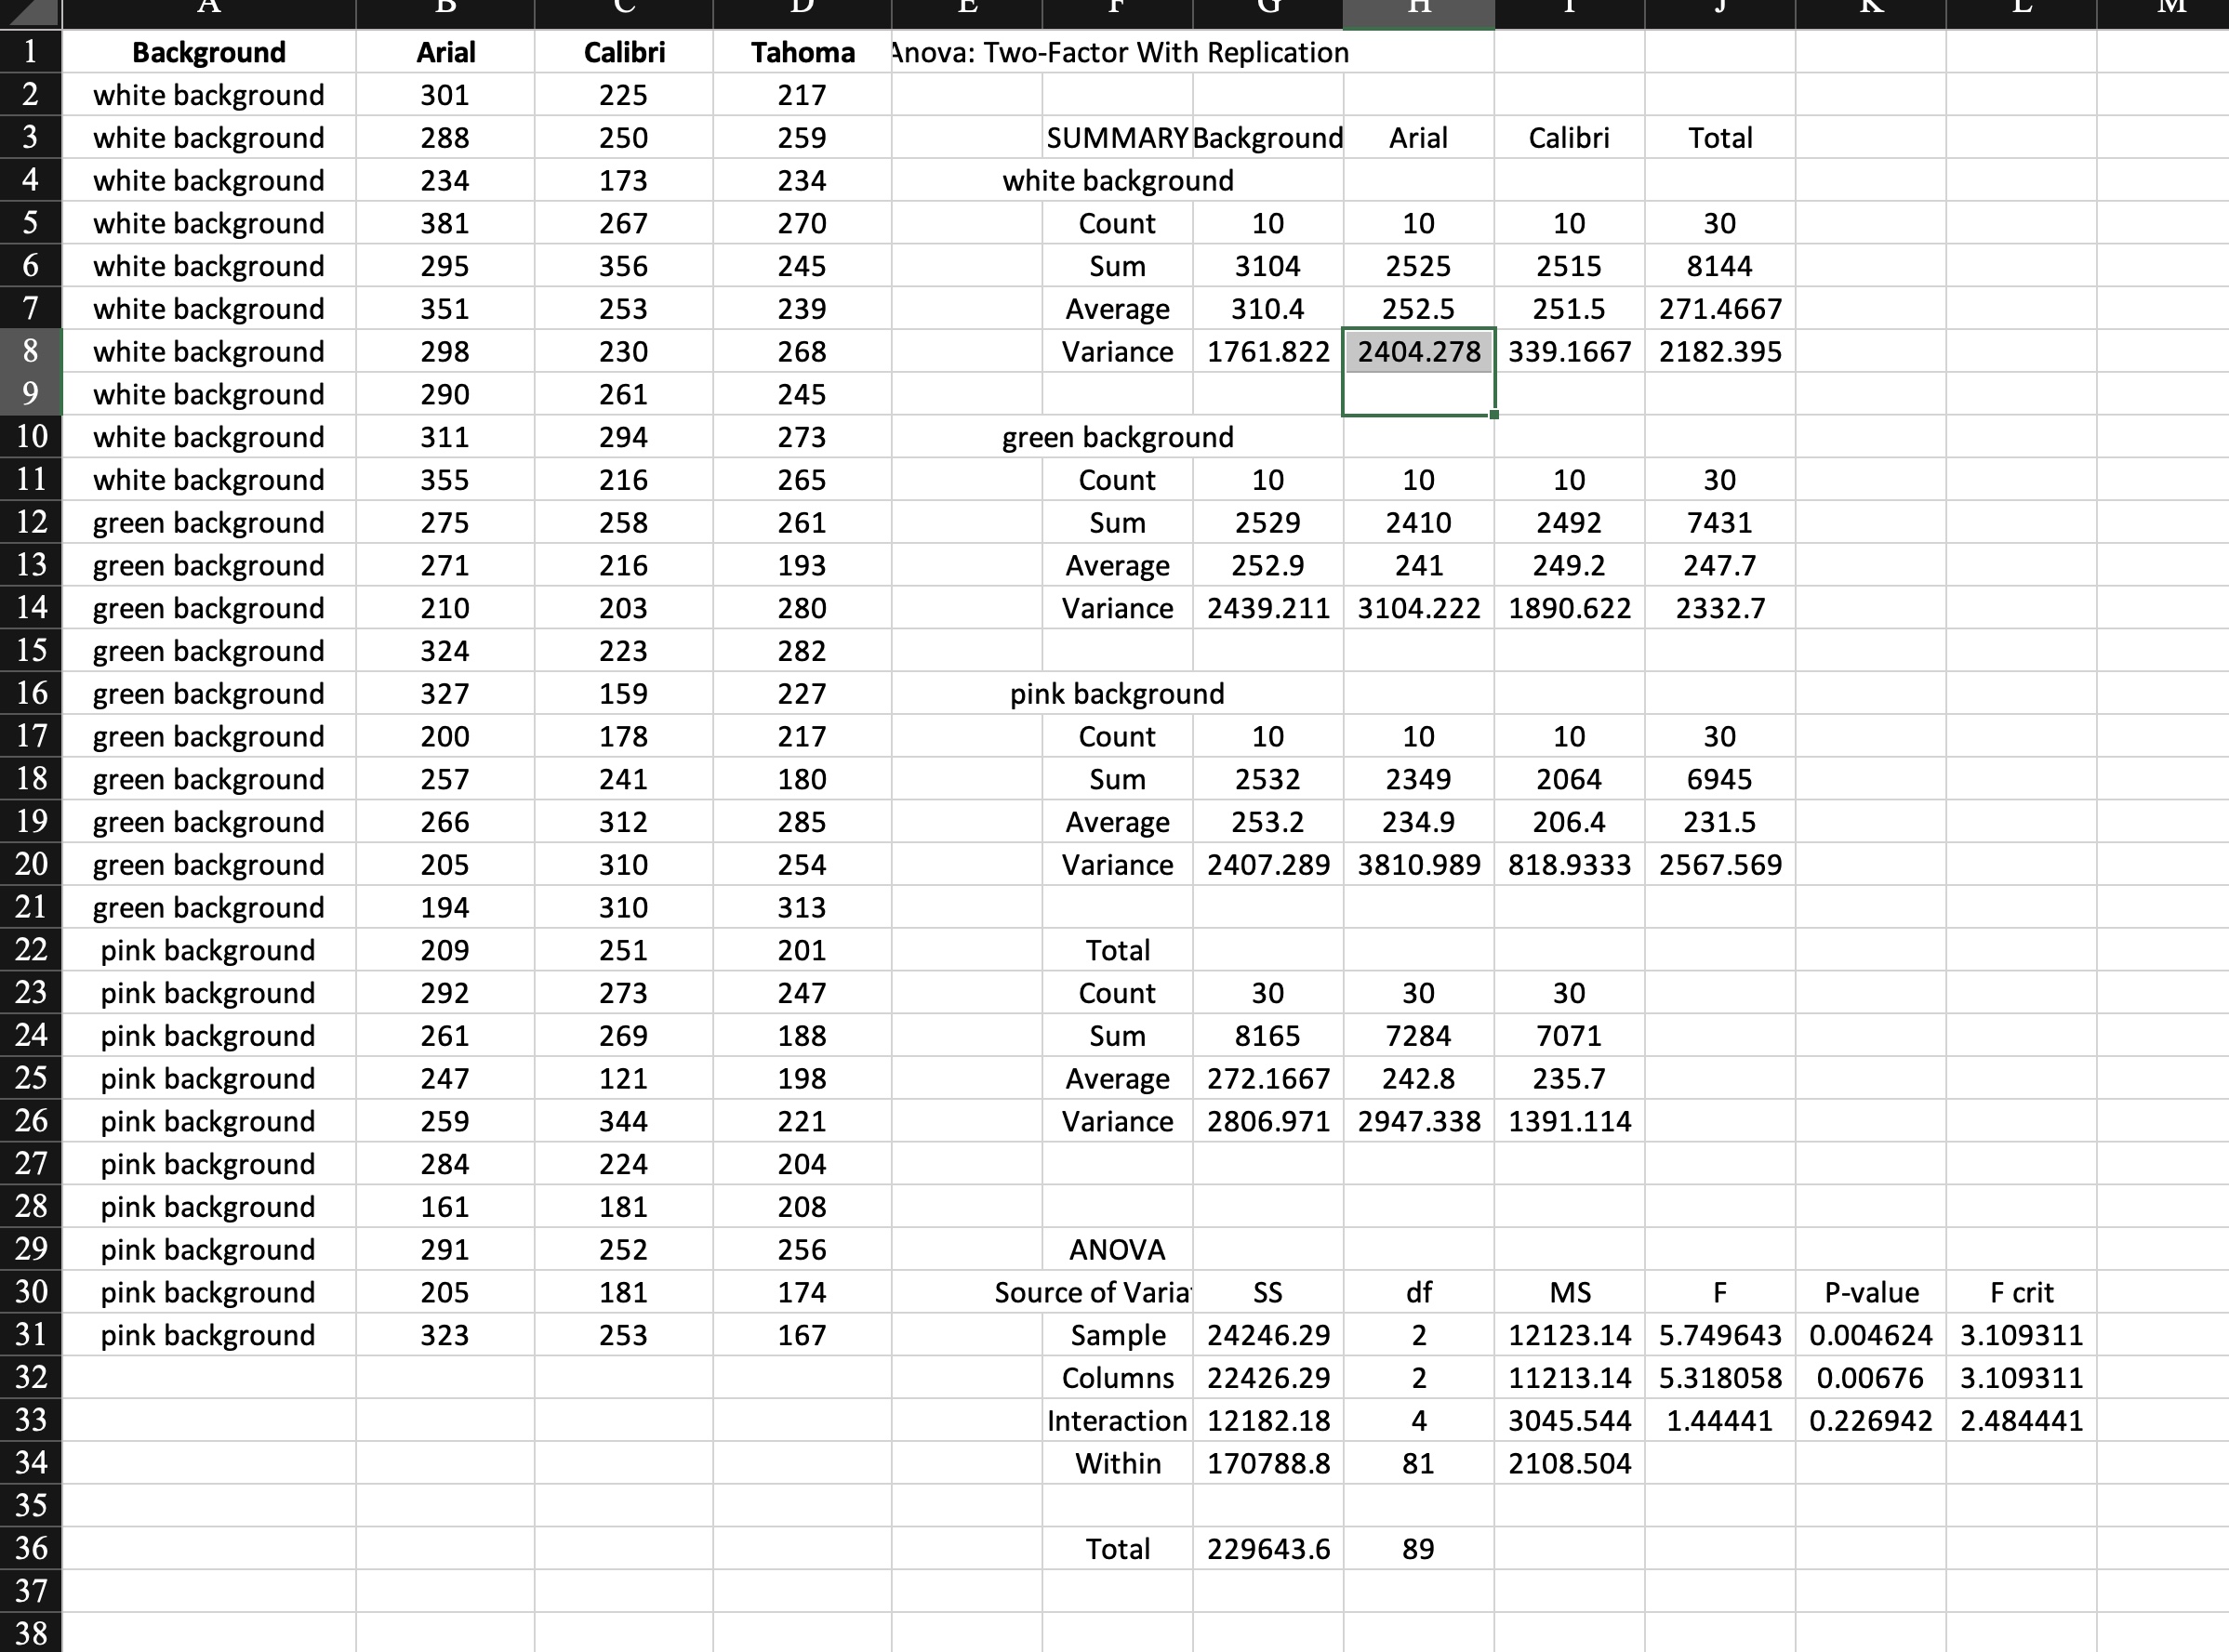
Question: Use the data from Triple T's study to test the hypothesis that the time spent by visitors to the Triple T website is equal for

  • Use the data from Triple T's study to test the hypothesis that the time spent by visitors to the Triple T website is equal for the three background colors. Include both factors and their interaction in the ANOVA model and use ? =.05.
  • Use the data from Triple T's study to test the hypothesis that the time spent by visitors to the Triple T website is equal for the three fonts. Include both factors and their interaction in the ANOVA model and use ? =.05.
  • Use the data from Triple T's study to test the hypothesis that time spent by visitors to the Triple T website is equal for the nine combinations of background color and font. Include both factors and their interaction in the ANOVA model and use ? =.05.
  • Discuss whether your data analysis results provide evidence that the time spent by visitors to the Triple T website differs by background color, font, or combination of background color and font. What is your recommendation?
Use the data from Triple T's study to test the
Background Arial Calibri Tahoma Anova: Two-Factor With Replication white background 301 225 217 W N white background 288 250 259 SUMMARY Background Arial Calibri Total white background 234 173 234 white background white background 381 267 270 Count 10 10 10 30 white background 295 356 245 Sum 3104 2525 2515 8144 white background 351 253 239 Average 310.4 252.5 251.5 271.4667 white background 298 230 268 Variance 1761.822 2404.278 339.1667 2182.395 10 00 white background 290 261 245 10 white background 311 294 273 green background white background 355 216 265 Count 10 10 10 30 12 green background 275 258 261 Sum 2529 2410 2492 7431 13 green background 271 216 193 Average 252.9 241 249.2 247.7 14 green background 210 203 280 Variance 2439.211 3104.222 1890.622 2332.7 15 green background 324 223 282 16 green background 327 159 227 pink background 17 green background 200 178 217 Count 10 10 10 30 18 green background 257 241 180 Sum 2532 2349 2064 6945 19 green background 266 312 285 Average 253.2 234.9 206.4 231.5 20 green background 205 310 254 Variance 2407.289 3810.989 818.9333 2567.569 21 green background 194 310 313 22 pink background 209 251 201 Total 23 pink background 292 273 247 Count 30 30 30 24 pink background 261 269 Sum 8165 7284 7071 25 pink background 247 121 198 Average 272.1667 242.8 235.7 26 pink background 259 344 221 Variance 2806.971 2947.338 1391.114 27 pink background 284 224 204 28 pink background 161 181 208 29 pink background 291 252 256 ANOVA 30 pink background 205 181 174 Source of Varia SS df MS F P-value F crit 31 pink background 323 253 167 Sample 24246.29 12123.14 5.749643 0.004624 3.109311 NN 32 Columns 22426.29 11213.14 5.318058 0.00676 3.109311 33 Interaction 12182.18 A 3045.544 1.44441 0.226942 2.484441 34 Within 170788.8 81 2108.504 35 36 Total 229643.6 89 37 38

Step by Step Solution

There are 3 Steps involved in it

1 Expert Approved Answer
Step: 1 Unlock blur-text-image
Question Has Been Solved by an Expert!

Get step-by-step solutions from verified subject matter experts

Step: 2 Unlock
Step: 3 Unlock

Students Have Also Explored These Related Mathematics Questions!